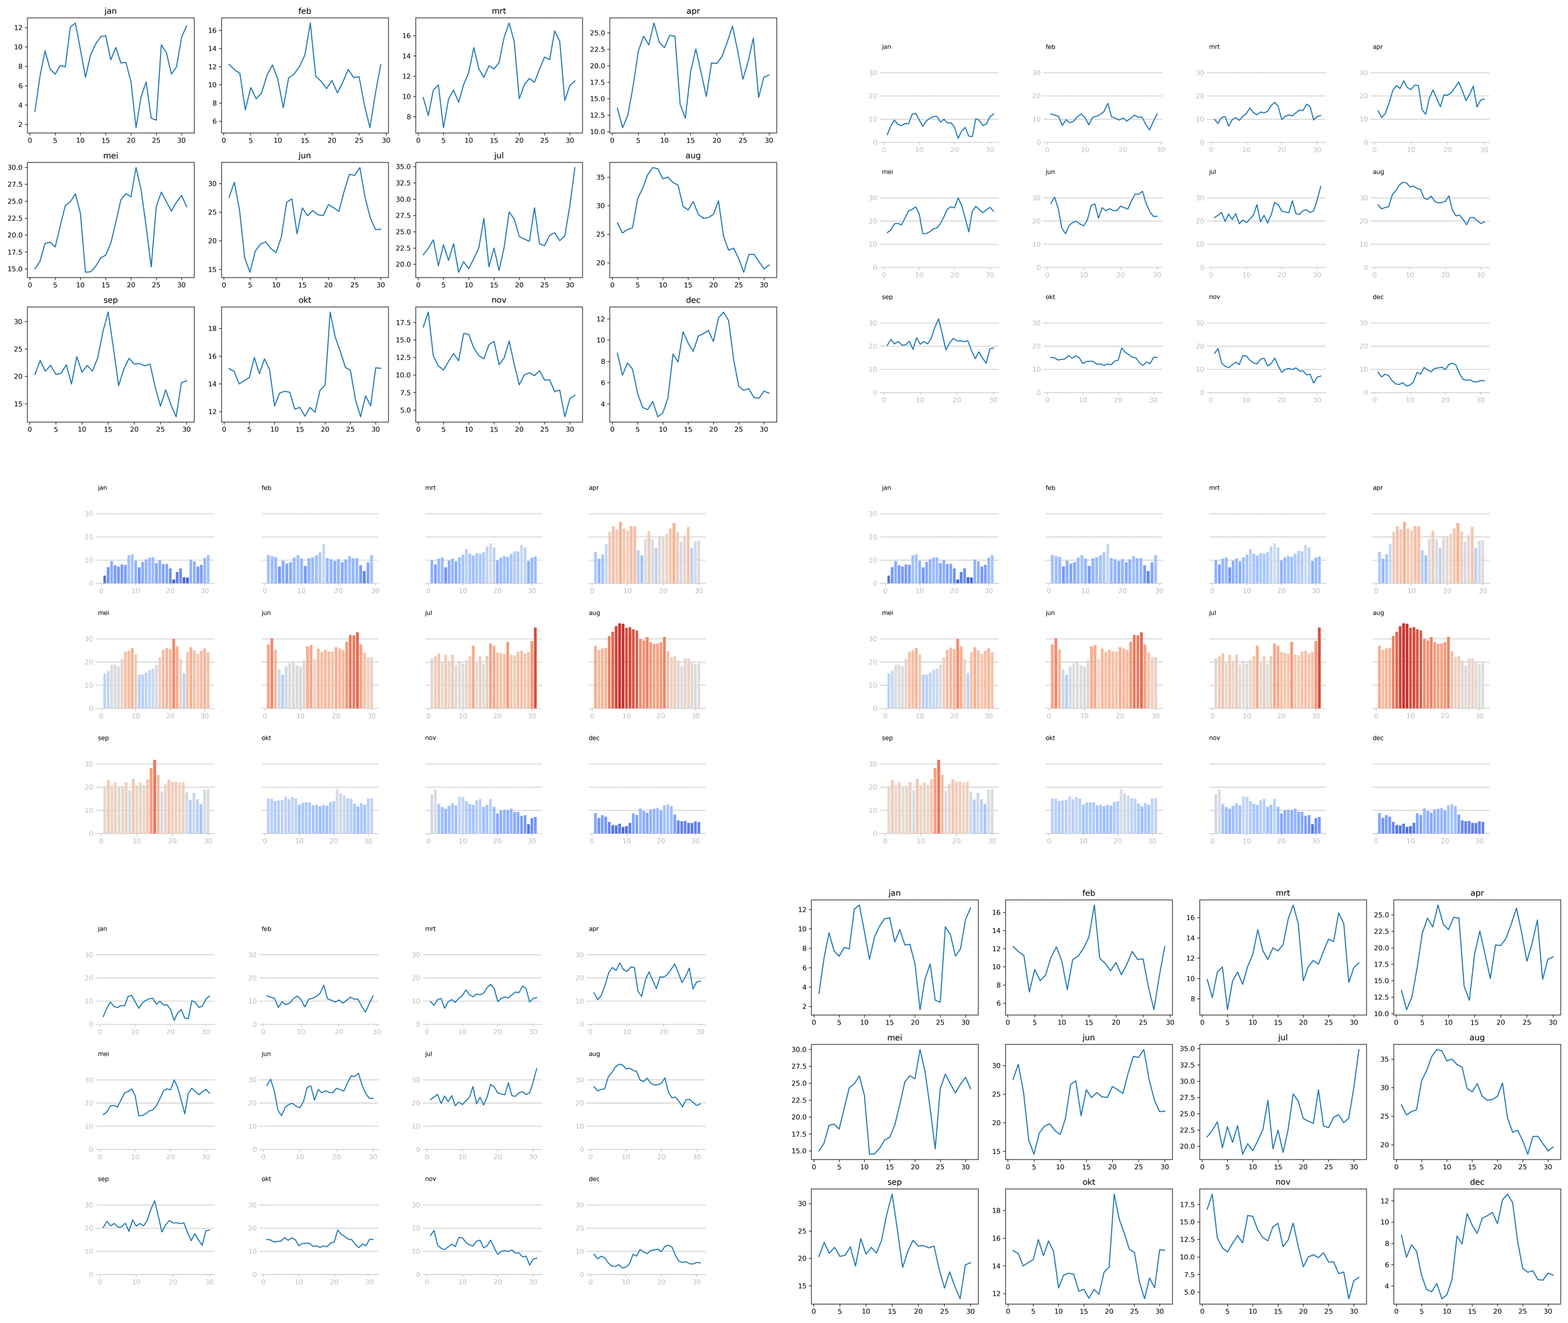
When I’m working on a programmatic data visualisation, I often want to keep track of my progress. I think it’s interesting to see my first plot of a dataset slowly transform into a nicer one. In this post, I’ll share a little trick to easily keep track of visualisation iterations in Python.
The trick: file names with timestamps
First things first. I used to develop using the plt.show(). Whenever the result looked nice, I saved the result manually. But I noticed that using this approach, I skipped some of the changes I applied. So I started using both plt.savefig() AND plt.show() using a manual filename. This time though, I was dependent on me remembering to change the file name every time I made a new plot. And as I am only human, I forgot. Not always, but regularly.
The solution to my (not so) big problem is easy: add a timestamp to my file names:
plt.savefig('viz_file_name_'+ str(time.time()) +'.svg')
plt.show()
That’s it. Now every time I run my code, a visual with a unique name will be saved. And since it’s a timestamp, the files are automatically saved in order. Pretty nice!
Combine your results into a GIF
The nice thing about saving your intermediary steps, is that you can combine them all into a single animated GIF. Here’s an example of such an animation of visualisation iterations:
I think animations like this are a great way to show the progress of visualisations.
