
I hosted session on scrollytelling at MeasureCamp Amsterdam 2023. In this session, I shared my experiences in developing scrollytelling pages. In this post, I’ll do just the same.
This post will introduce you to scrollytelling: what it is, how I got started, how it works, and how you can get started yourself.
What is scrollytelling?
So, what is this thing called scrollytelling? I know about the technique through data journalism. I think I first saw it being used in content by big US newspapers.
It is easier to see what scrollytelling is, than to describe it. So, I encourage you to open the next two links and read or scan both pages:
Welcome back.
As you can see, these stories offer an interesting reading experience. One where data changes in the background, based on where the reader is in a story.
They sure look nice, but the quality is also a bit overwhelming. It is something so different from what I’ve done before, that I don’t even know how to get started.
How I got started with scrollytelling
Sometimes you need an example that bridges the gap between not knowing what to do and the nice-looking examples we’ve just seen.
In the summer of 2022, Goof van Winkel hosted a few small-scale online meetups for people in data visualisation. In the session I attended, Tiago Maranhão Barreto Pereira shared a first versions of a data story he was developing with scrollytelling.
Tiago’s demo was exactly what I needed. Seeing a concept version of a scrollytelling page somehow made me confident that I could make one as well.
When I was ready to get started, I asked Tiago for some advice on code libraries to use.
And I was ready to go.
How does scrollytelling work?
A scrollytelling library simplifies the process of developing a scrollytelling page. Let me explain it with a simple example.
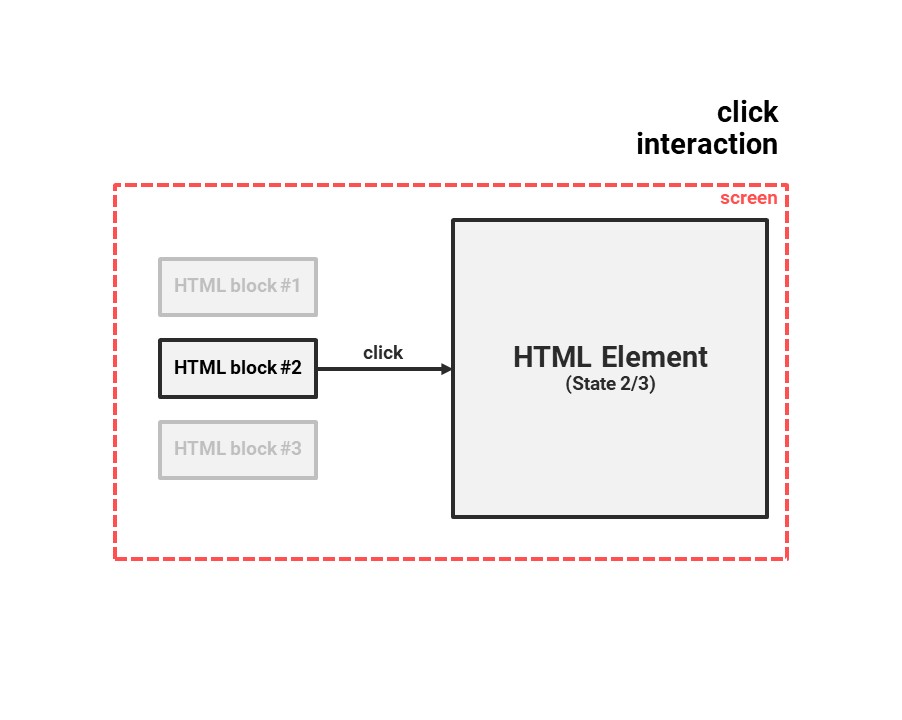
Users can interact with a website. An example of such an interaction is a click on a button. When a user clicks the button, something happens on the website.
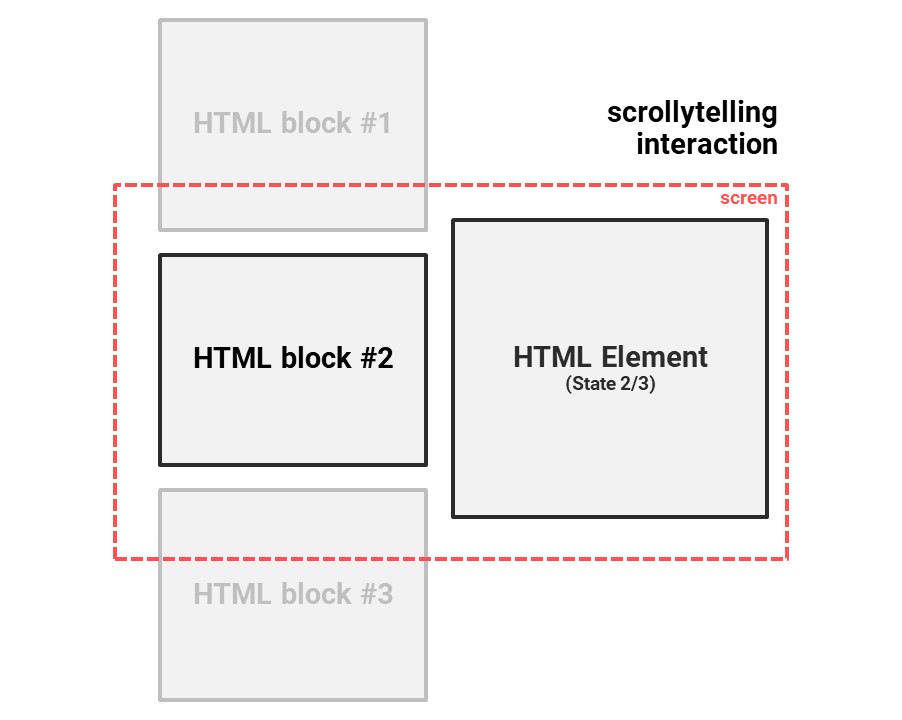
You can think of scrollytelling as a new type of interaction. One where you scroll through a story on a page, and the section of the story that is visible triggers an interaction.
In this example, you are at section two of the story and an HTML element is updated accordingly:
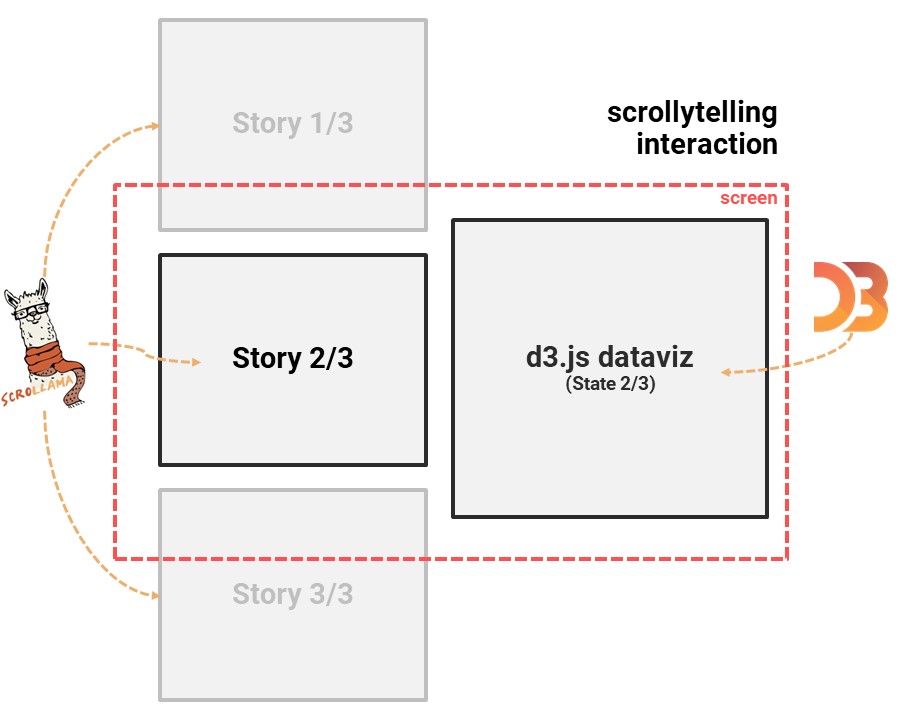
To create a data story using scrollytelling, you can combine two open-source JavaScript libraries:
- Scrollama.js – for scrollytelling
- d3.js – for creating and manipulating charts
Scrollama.js handles the scrollytelling interactions. These interactions trigger the execution of your d3.js code:
Data stories I’ve made so far
Since that moment, I’ve worked on four scrollytelling pages. The pages are on the one side technical exercises that force me to use scrollytelling and on the other side I’ve tried to write an interesting story for all of them.
1: Avicii Open Data Art Story
The first scrollytelling page I designed was for my personal data art project. It was quite a challenge for a first design, as it includes multiple visualisations and animations. View data story › (designed for Desktop only)
2: LionRock Maritime Fuelsaver Story
Based on the Avicii demo, one of my clients asked me to design a page explaining his core product. View data story ›
3: A Year in Running (Dutch)
In this personal data story, I look back at a year in running. As I made over 130 runs that year, the main challenge was to make it scale well, as each run was a step in the story. View data story › (Dutch)
4: Google’s View on Heaven

This exploratory data piece is my first scrollytelling story that includes both static and animated plots. View data story ›
Bonus: some learnings
Here are three things I’ve learned by developing multiple data stories with d3.js and scrollama.js:
- Develop plot animations separately: I develop the plot animations of my story before I implement them in a scrollama.js setup. You can view an example of how I did so for the data art story here. It’s easier to develop the steps like that, than having to scroll down to the bottom of a page each time to review a change.
- Stories can move forwards and backwards: keep in mind that a user can move the story forwards (by scrolling down) and backwards (by scrolling up). Luckily, srollama.js makes it easy to take the direction into account.
- Fixed step heights on mobile: by default, scrollama.js triggers a new story section based on a percentage of the screen height (e.g. 75%). This can result in strange behaviour on mobile, as the address bar is hidden when scrolling through the page, changing the relative height. You can fix this by setting the step height to a fixed height.
How you can get started with scrollytelling
By now, you may want to give scrollytelling a go yourself. To do so, you need to have some experience with html and css, and you need to know how to program in JavaScript.
If you’ve checked these boxes, these resources will help you get going with scrollytelling:
- Scrollama.js docs
- d3.js docs
- d3.js graph gallery
- d3.js for the impatient (Philipp K. Janert, 2019) [Book]
Besides the technical part, here’s an overview of the process I use when setting up a scrollytelling page:
- Idea: you have to have an idea of the story you want to tell.
- Sketch: draw a storyboard for each step of the story and the data you want to show.
- Make plots with d3.js: turn the visualisations from your sketch into d3.js visualisations.
- Set up the story with scrollama.js: implement the d3.js-plots into a scrollama.js page.
- Make pretty & warp up: the last, and often hardest, part is turning the working setup into a good-looking, presentable data story.
Well, that’s it.
I hope this page has done two things.
First, I hope it made you excited for scrollytelling.
Besides that, I hope it gave you the confidence to start using the technique yourself.