
In October 2019, I presented a personal project at a data visualization meetup in Amsterdam. The goal of my talks is to share my experience and maybe inspire someone here and there. But this time, something special happened. Someone saw my story, it resonated with him, and asked me if I could help him out with a startup.
Lionrock Maritime
During the meetup, I had a nice and open talk with Rick Broersma, the founder of a startup called Lionrock Maritime. His startup helps towage businesses with new insights in their fleet. It allows them to lower their carbon omissions. This is both good for the business, as they save money, and good for the environment. It is a true win-win.
We decided to stay in touch and a few days later he had a question for me. He asked me if I could help him out with his reports. He was making the reports manually right now and wanted to automate the process.
A lean approach to the problem
We initially discussed possibilities for a dashboard application that his clients could access. But during our talks, we decided that this may be too much for now. The clients are happy with the reports the currently get. Because of that, we decided to focus on process automation.
The goal of the project was set: automatically translate a raw data sheet into PowerPoint reports for clients.
The product
The nice thing is that Rick can write code himself. This made it easier to help him out. I could focus fully on writing code that would automate his routine. The result was a Python project that automates his PowerPoint creation flow. It picks up a raw data sheet, turns this into relevant data for his reports, visualizes the data in graphs, and generates a full report.
I also spent some time on a readme for the project and we met up so I could show him how to use it himself. All Rick has to do now is provide a raw data file and set a configuration for his reports in Python. After that, all he has to do is run the script.
Here are some samples from the reports:
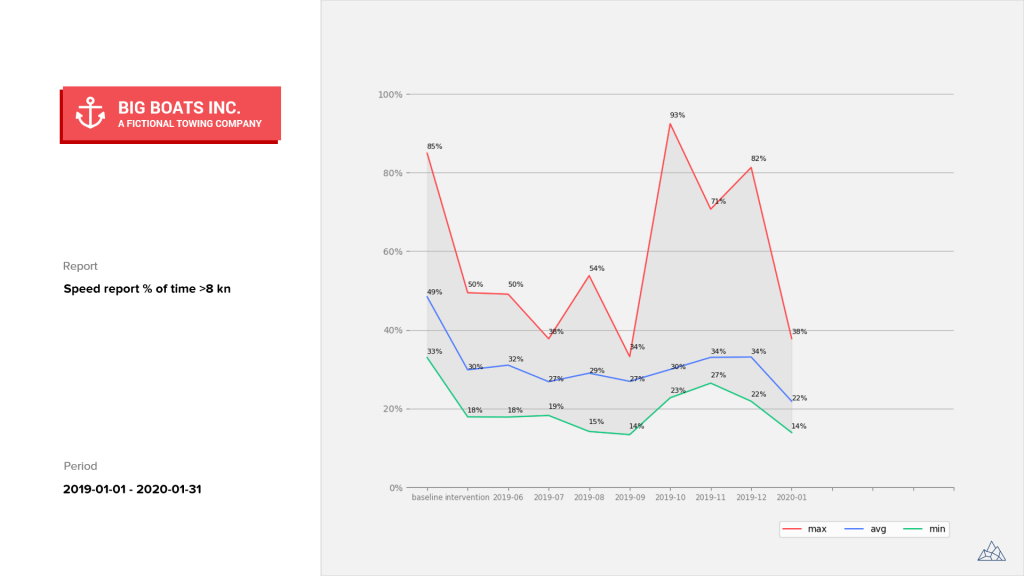
Example of a trend report.

Example of a captain comparison report.
Pretty nice. And keep in mind that this is fully generated by some Python code.
The review
I’m really happy with the result. But it always good to check if the client thinks the same about the result. Rick was nice enough to share his experience:
Through Erik’s work I can offer my customers a product that looks professional in an efficient manner. Erik’s ability to understand the material, his clear communication and his friendly cooperation make for an engaging process as well. I can strongly recommend Erik.
The client is happy. I am happy. All good.
Measuring automation
Now automating routine is nice. But as you may now, I’m an all-round data enthusiast. So, I decided to add a few lines of code that would print the time it took to generate the reports. It turns out it takes 20-60 seconds to generate the reports, depending on the size of the input file. That is pretty nice. I remember Rick’s first reaction when I shared this with him:
The power of technology feels really confronting when a computer completes a job you know through and through in a fraction of the time.
That is true. It is a good reason to automate routine. It frees up time that you can spend doing the things you are good at.
My personal highlight
It did not take long for Rick to start modifying the code himself. That is something I really like. It means he has started to understand the project and feels confident enough to modify it. I’m a big fan of automating routine. And I’m also a big fan of empowering others to do so.
His startup is a win-win for the business he helps and the environment. And this project win-win for both him and me. Good stuff.