What data I show when I show data about Haruki Murakami
This is a visual tribute to Haruki Murakami's novels.
It translates the rhythm of his stories to a series
of data animations and data illustrations.
The tribute currently includes
the city and its uncertain walls,
1Q84,
Kafka on the shore,
the wind-up bird chronicle, and
killing Commendatore.
Exhibitions
The work is on display at these locations:
-
Exhibition data animations at LocHal, Tilburg:
Sunday November 9 - Sunday November 16.
More info.
You can experience the project in two ways:
as data illustrations
or data animations.
You can find notes on the data behind the project
here.
illustrations per book
The data illustrations resemble the idea of the novels as
they form in the mind of Murakami,
where simplified Japanese sliding doors (shoji)
reveal the story chapter by chapter.
There is a brief explanation for each illustration.
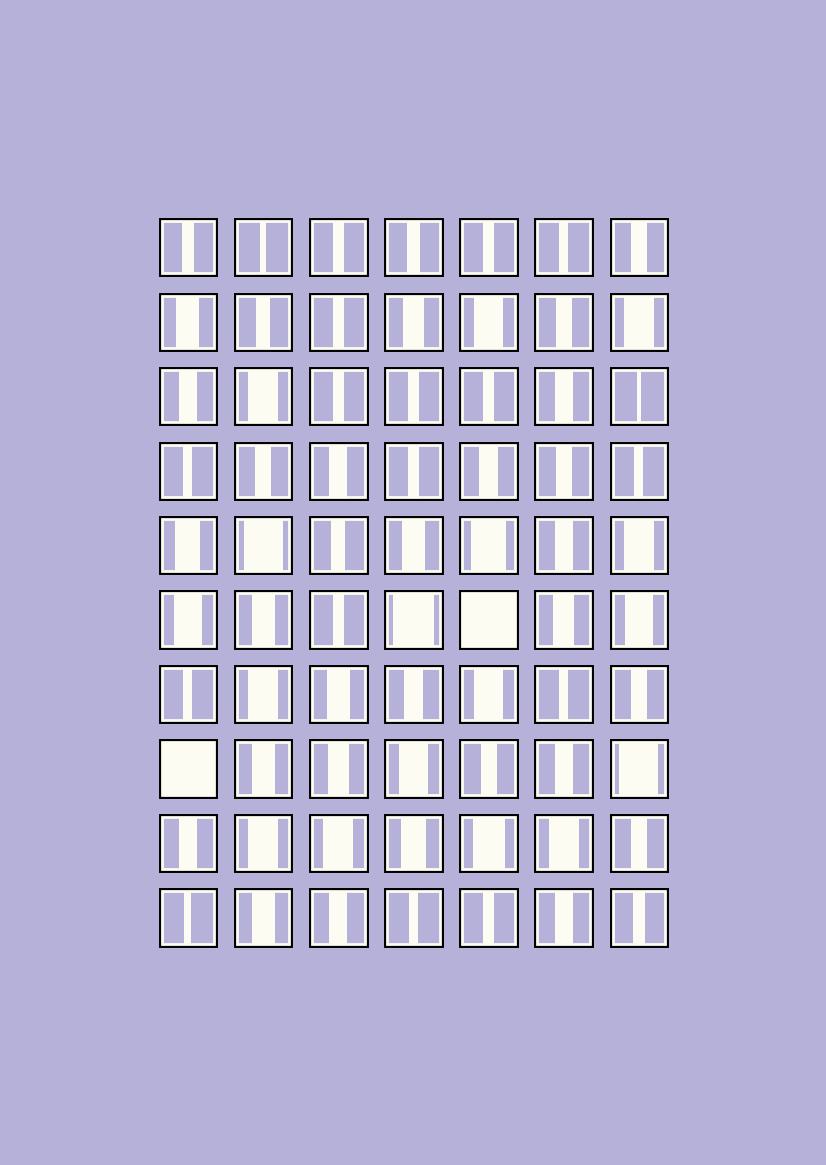
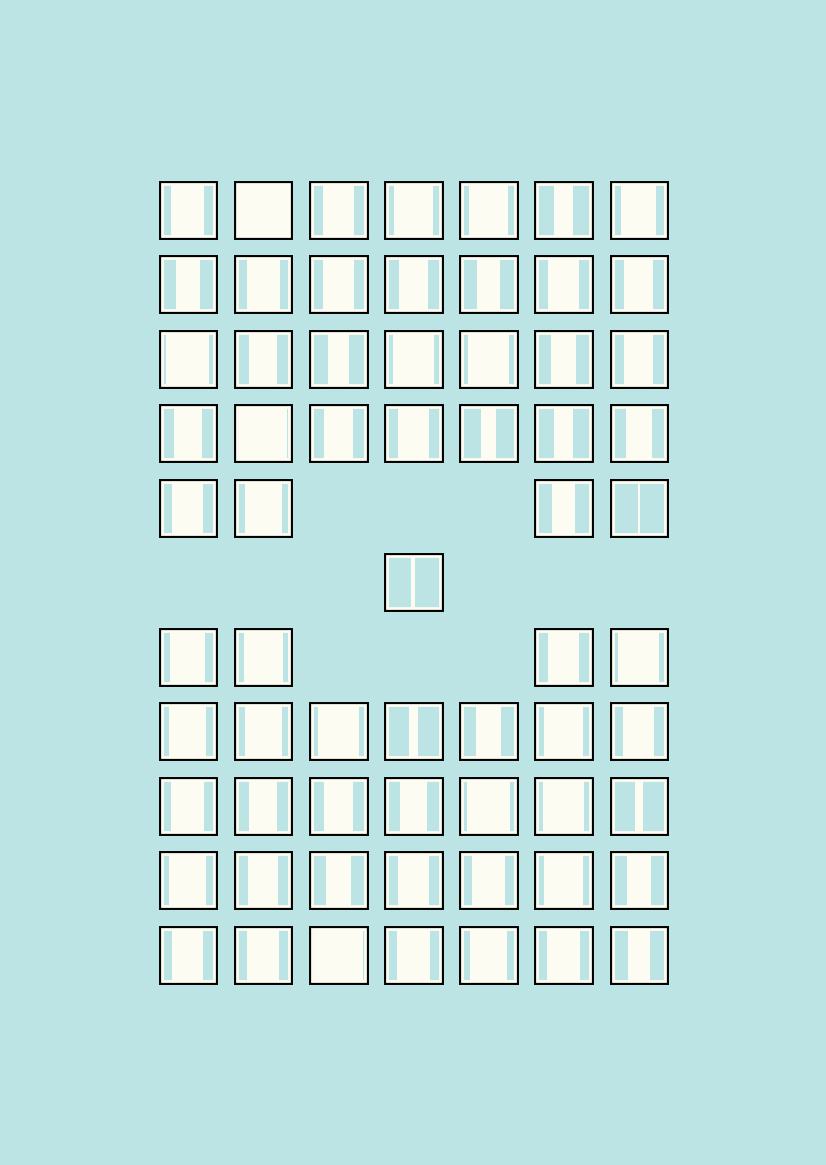
CITY
The first data illustration I made is based on the city and its uncertain walls.
The 70 chapters form a nice 7 by 10 shoji grid and resembles the uncertain wall.
The colour - greyish lavender - was sourced from the colour books of Sanzo Wanda (all other colours are too).
I think the colour is a nice fit for the main character:
a nice person (lavender) that somehow feels something is off (greyish).
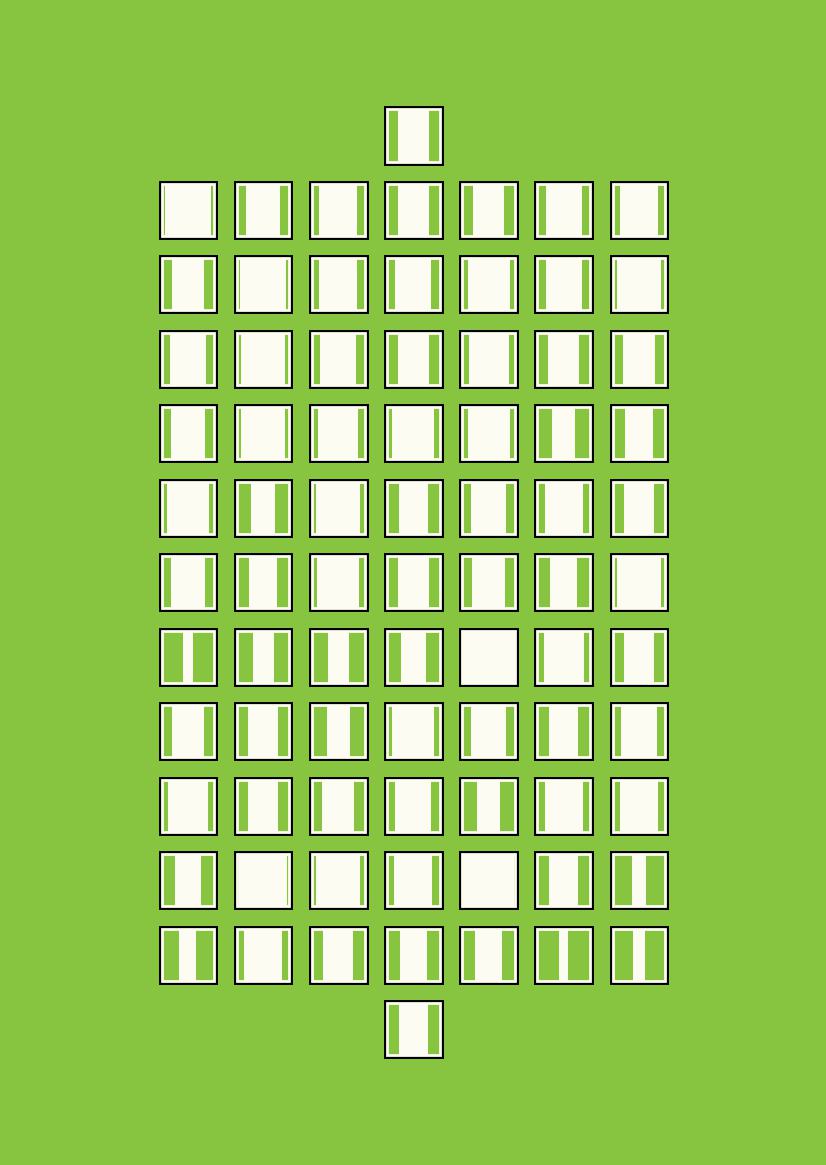
MOON
This visualisation is based on 1Q84.
I kept using a 7-chapter-per-row grid for the other books.
That choice resulted in a challenge, as not every book has a 7-fold chapter count.
This book has 79, or 7 x 11 + 2.
I decided to use the extra two chapters creatively,
showing one at the top and one a the bottom.
This way, they resemble Tengo and Aomame in the story:
two people that are looking for each other.
The colour - night green - is based on the moon.
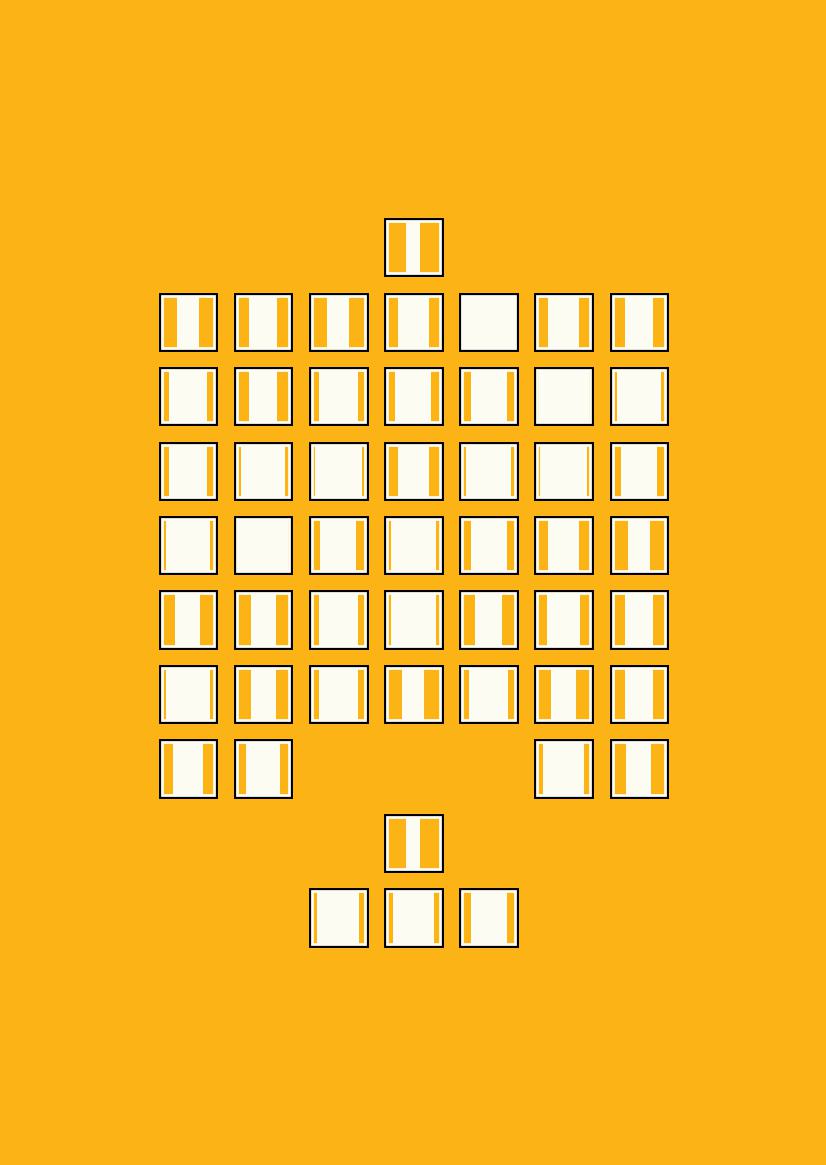
KAFKA
Based on the book Kafka on the shore.
I broke up the 7-row grid based on the two numberless chapters,
a boy named crow.
The colour - orange yellow - is inspired on the beach.
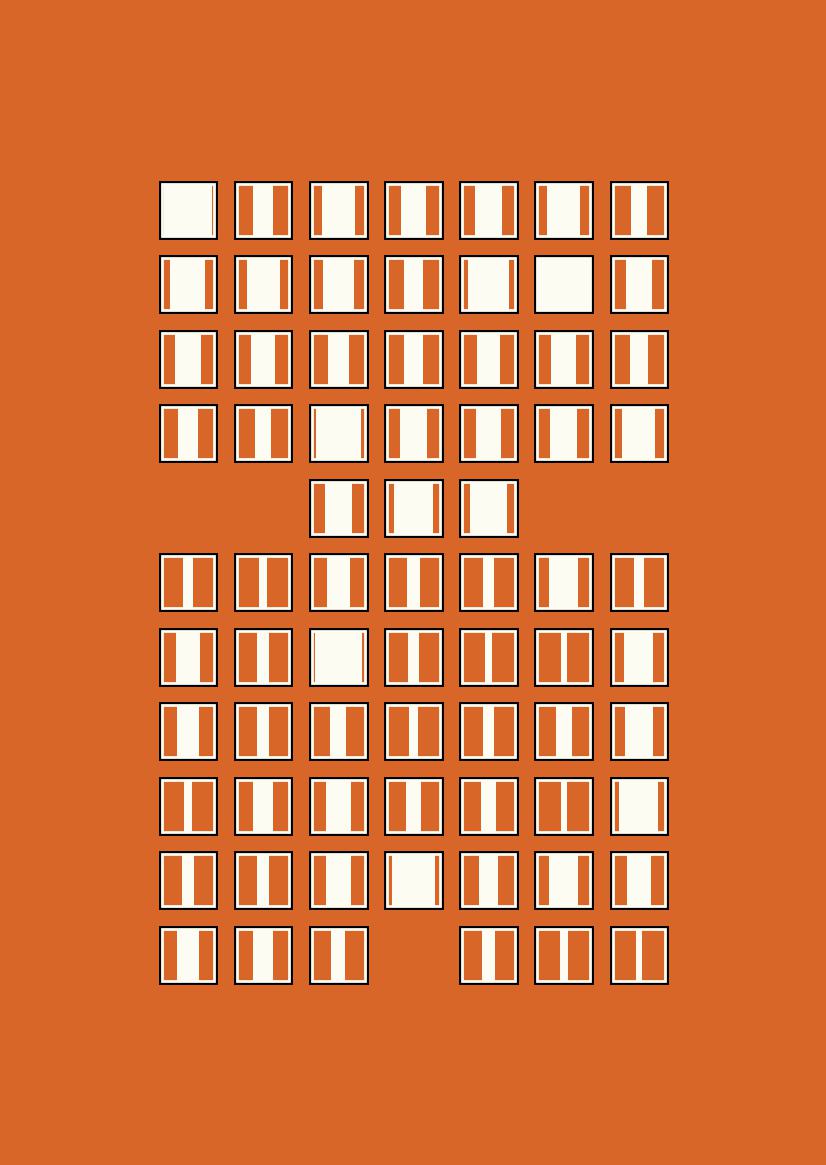
BIRD
Based on the wind-up bird chronicle.
This time, the grid is tweaked to resemble a large building,
symbolizing the building the main character enters for treatment.
The colour - English red - is based on Malta's hat.
BELL
Based on killing Commendatore.
This time, the grid is split into two parts based on the sections in the book (32 chapters each).
The shoji in the centre is the prologue,
resembling both the bell and the man without a face.
The resulting image resembles both the pit in the forest and the river the main character needs to cross.
The colour - Nile blue - also resembles that river.
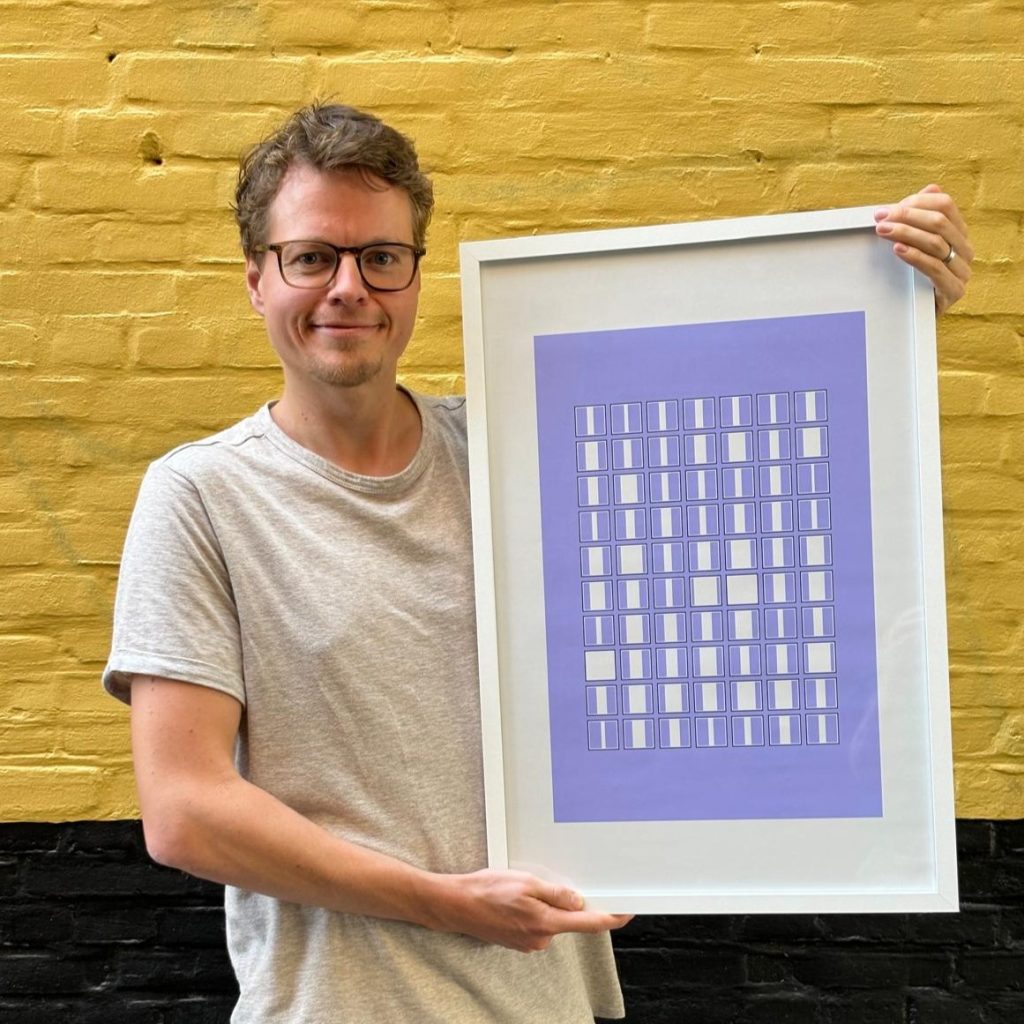
CITY in print
Do you want to one in real life?
There is a early concept print of the CITY in Buutvrij (a coffee shop in my local town, Tilburg).
If you are around, make sure to have a look!
Data Animations
With modern technology and data - often associated with fast-paced digital society -
the slow animations calm the mind of the viewer and prepare it to start reading a novel.
The animations are inspired by Haruki Murakami's intuitive writing style.
The idea for a novel builds.
When the grid is completed, the urge to start writing appears.
Murakami then writes the story intuitively, chapter by chapter.
The data animations give a speculative insight
into the mind of the author.
The images resemble visual poetry, revealing the story chapter by chapter.
The data animation below is based on the city and its uncertain walls
and takes about 7 minutes to complete.
You can view this and other data animations as a stand alone application using the links below.
Videos
Prefer videos?
You can view the youtube playlist
here.
How data contribute to the work
I develop this project in the same way Haruki Murakami writes.
I didn't know where it would go when I started end the end is still unknown.
Books
Books are the main source for the illustrations and animations.
Besides the book visualized, a few other books have played a role.
His autobiographical works what I talk about when I talk about running and
novelist as a vocation have been used for research.
Hard-boiled wonderland and the end of the world plays a role in the animation order.
Ohter sources
Each visual resembles one book.
Every shoji resembles a chapter.
Its doors open more or less based on chapter length.
For the longest chapter in a book, the doors open fully.
The doors are partially opened for shorter ones.
Besides that, the grid and colour are based on a story element.
The slowness of the animations resembles both the long process of writing a novel and
the time it takes to read one.
Intuitive sources
When working on the project, some things just feel like the right thing to do.
Later, I learn more about the motivations behind these intuitive decisions.
One of these is the the simplified Japanese sliding doors.
Murakami writes in a sort of simplified Japanese language, a style he developed.
The sliding doors in the project are used in a similar manner.
The shapes also make viewers think of windows.
Murakami aims to
"open a new window in the mental wall of the people and let fresh air blow in".
origins, page count, more details
The idea for this project came to me during a holiday in the summer of 2024.
After reading the city and its uncertain walls, I felt a rising urge to make a data visualisation project about the book.
The first result of this urge was a static version of the shoji visualisation for that book.
Later, I thought the shoji fitting for Haruki Murakami's work, so decided to add more of his books to my project.
I use a small and easy-to-understand dataset for this project: the page count of each chapter.
Using code, I calculate the relative length of each chapter within the context of the book.
This relative length (e.g. 87%) opens the doors of the chapter's shoji.
The length of each chapter also determines the time it takes for the doors to open.
The order of the animation is pseudo-randomised using a random seed based on Murakami's book titles.
I chose a slow animation speed because I think it fits the pacing of Murakami's novels.
I also think that in a time of fast-paced change, there should be room for slowly evolving work,
things that require your attention for minutes instead of seconds.
The books I included in this project are a collection of the Dutch editions of the longer novels by Haruki Murakami.
Say hi
Want to say hi? Go here.
Acknowledgements
It's both easy and hard to try and thank everyone that helped me make this project somehow.
Let me start with the easy bit.
This project would not have been made if it wasn't for Haruki Murakami picking up writing.
Thank you Mr. Murakami.
Besides that, I'd like to thank the translators at Atlas Contact, the Dutch publisher of his novels.
The harder bit is the list of indirect influences.
Things that happened at some point in the past and unintentionally pushed me towards this project.
I'd like to thank Chip Kidd, a graphic designer and the designer of the American 1Q84 cover,
for sharing his thoughts on book cover design and pointing me to Haruki Murakami's work.
Likewise, Adam Savage, former Myth Buster, named 1Q84 as one of his top science fiction books.
These two referrals made me read my first Murakami.
On a technical level there were a couple of important influences.
First, the graduation internship I did for a project by Ralf van Lieshout,
during which I discovered d3.js (a data visualisation code library).
Second, Thom Hopmans was the person who introduced me to python, a programming language.
Both python and d3.js are an essential part of what makes this project tick.
And last of all I want to thank my wife.
She gave me a beautiful edition of the city and its uncertain walls as a surprise gift.
It was through her unintentional, but also convenient, timing
that this idea started brewing and how it got where it is today.