
I just ran my first art exhibition. Five data art animations based on novels by Haruki Murakami were on display for 8 days in the main library in city of Tilburg in the Netherlands. As it was my first, the whole process was new to me.
In this post I share three things I’ve learned by running this exhibit.
1: Start early
Setting up an exhibit takes a lot of work. When the local library offered me this opportunity, this was my first thought:
Nice! My data art will be displayed in public!
It’s a very nice feeling to have, but I slowly started to realize I would need to put in work to make it work. Questions started forming:
- How do I communicate my idea to the audience?
- How do I furnish the exhibition area?
- How often do I plan to be there for live commentary?
- What options do I have for promoting the exhibition?
- Do I want to show all my work or only a selection?
- Does the exhibition room have limitations I have to take into account?
These questions (and some more) all need answering. I tried to work together with other people where possible.
For promotions, I checked the options the library had and in what ways they could support me. I turned out I was allowed to spend some money on posters and flyers. Besides that I tried to invest time in promoting the exhibition myself: I shared the exhibition in my personal network; emailed/messaged friends, family and other close people; and contacted the local newspaper (who published a piece in their physical paper!).
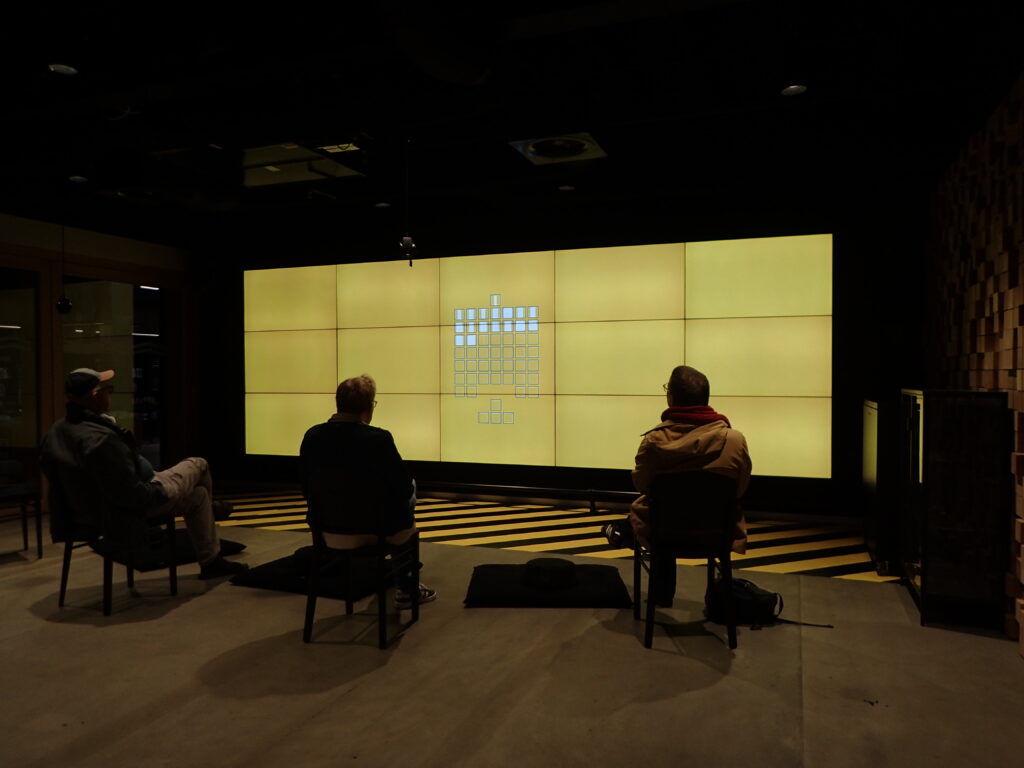
I also drafted some plans for the exhibition area. These plans included an idea for the furnishing and what would be on display. I had some time to test my plans the day before it opened. It turned out a few things didn’t work and only distracted from the main piece of work on display: the animations. I decided to minimize the setup (less = more), making it easy to focus on the animations.
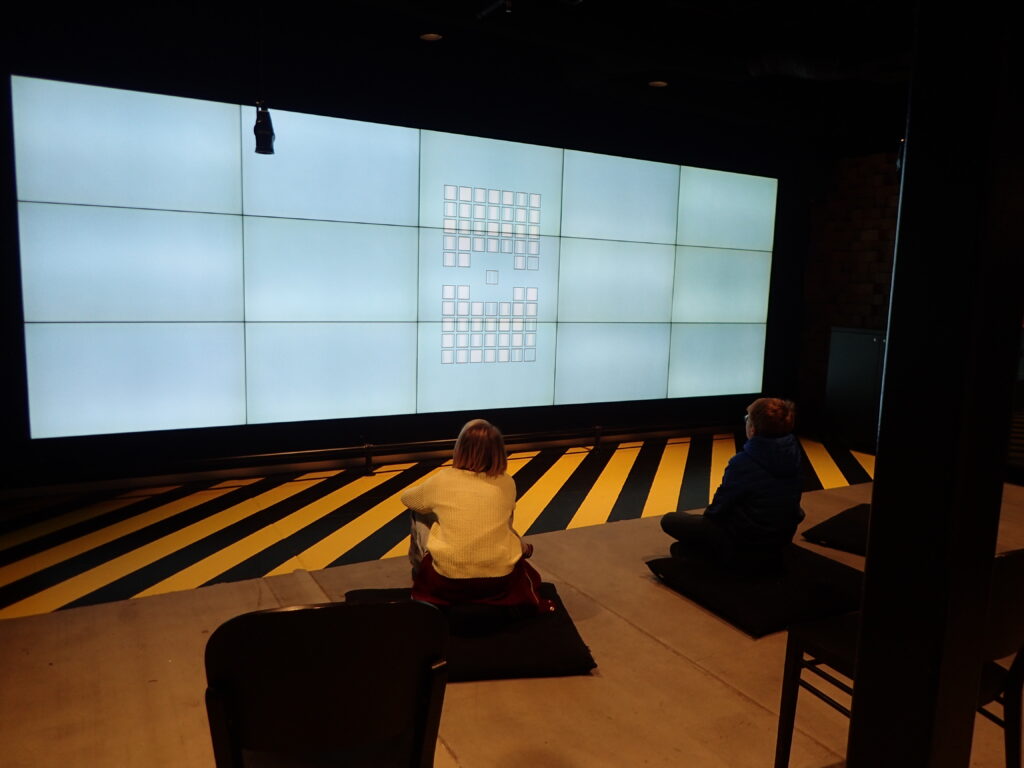
There was another thing to work out: the screen. As you can see in the images, the screen is actually a collection of smaller screens. This results in black lines running through the images. Luckily, the person that took care of technical side of the screen was a friendly and helpful man. We tested a few versions and decided a setup with the lines clearly running through the work was the best option.
My advice: start early and map out the things you can do to make a successful exhibition. It gives you an idea of the scope of work and the options you have. You can decide later what to pick up on and what not to.
2: It’s great fun
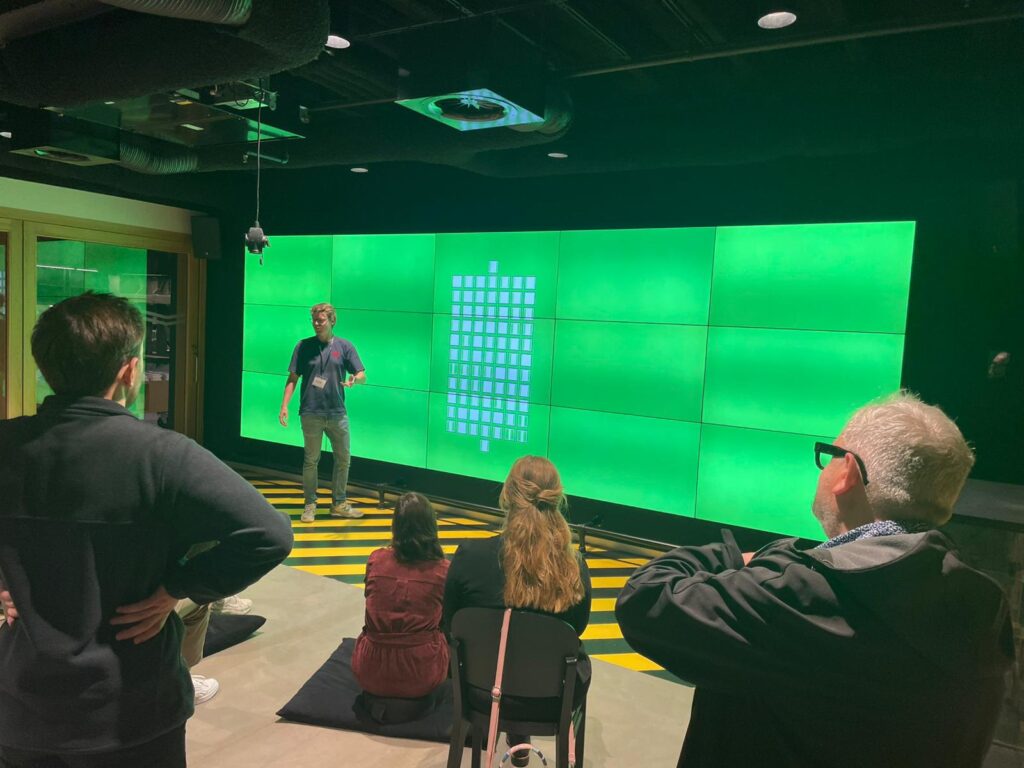
Over the course of 8 days I talked to ~85 people about the project. They had different ages (10 – 70 years old) and backgrounds. Some visited because they just happened to walk by, others read about it in the newspaper, and some were people I personally invited and came to visit.
Some were Haruki Murakami fans, others never heard of him.
The exhibition was also a first test for my work. The animations are slow. When I view them, my mind calms down. Would other people feel the same way? I turns out they did! People shared their feelings after watching the animations: “relaxing”, “zen”, “feels like a digital campfire”.
Something else started happening. I started to tweak my story a bit with every talk I had. The story of my work slowly started changing. Having these face-to-face talks with real people in front of my work (on display on a huge 2 x 5 metre screen!) changed my own perception as well.
For example:
I used to see the work as a collection of calming, meditative animations base on the rhythm of Haruki Murakami’s novels. I now see them a way to visualize the idea of a novel as it forms in the mind of Haruki Murakami.
3: Rethinking how and when I share my work
Having an opportunity to run a data art exhibition is great. Setting it up took some time and the talks with various people were fun and valuable. It all resulted in a new way of viewing my own work.
In my enthusiasm, I used to quickly share an idea, or a part of it, with people as I met them. But sometimes, a piece of work needs some more room, a space that contributes to the work. My first exhibition did exactly that. Because it worked so well, I am a more careful now with pulling out my phone or laptop and quickly sharing a piece of my work. It feels like the work deserves better.
Bonus reading tips
I read two books that helped during my preparations.
One is novelist as a vocation by Haruki Murakami. The animations of the exhibition are based on his fiction novels. I read this book for research purposes. Besides interesting reflections on the life of a writer, it included this lovely piece of advice (paraphrased):
Whether you like it or not, people are going to criticize the work you make. So you better make something you like, so at least 1 person likes it. And if your lucky, others will like it as well.
Reading this made my nerves go a way.
The other book that helped me: the creative act by Rick Rubin. As a creative data person, I felt right at home in this book.
Rick compares being creative to fishing (paraphrased):
Being creative is like fishing. You cannot influence if there are any fish to catch, you can only make sure your fishing rod is out there.
The ideas I work on feel exactly like that: at some point in time, my brain puts things together, goes “pop”, and I catch a fish. The fish I caught in August 2024 resulted in one data illustration, which turned into a series of illustrations and animations, and that recently transformed into my first data art exhibition.
A good catch.