
This is a visual tribute to the novels by Haruki Murakami. It translates the ideas behind his magical stories into a series of data illustrations and animations.
Each novel is translated into a data illustration and animation. The animations are silent and slow. They visualizes both the ideation process for a new story in the mind of Haruki Murakami and his intuitive writing process.
The animations are made with the same types of data and technology that contribute to the fast-paced contemporary society, but offer an alternative application for them: they calm the mind of a viewer, preparing it to start reading a novel.
The series currently includes the following novels:
- The City and Its Uncertain Walls
- 1Q84
- Kafka on the Shore
- Wind-up Bird Chronicle
- Killing Commendatore
- Colorless Tsukuru Tazaki and his Years of Pilgrimage (coming 2026)
Click the links to view that novel’s data illustration, animation and background information.
Prints
Would like like to put one of these on your wall? I make A2 poster prints on request. Interested? Reach out to me here.
Background information
After reading The City and Its Uncertain Walls, I felt a growing urge to create a visual tribute to the book. I enjoyed the story a lot. I started exploring ways to use a simple data set (page numbers per chapter) and data visualisation – a method that translates information into images – to create an interesting image. I worked on the idea intuitively and created several images until I experienced a click with one of the images.
Curious to see some of the test visuals I made? I talk about the visualisation process and initial test prints in this blog post.
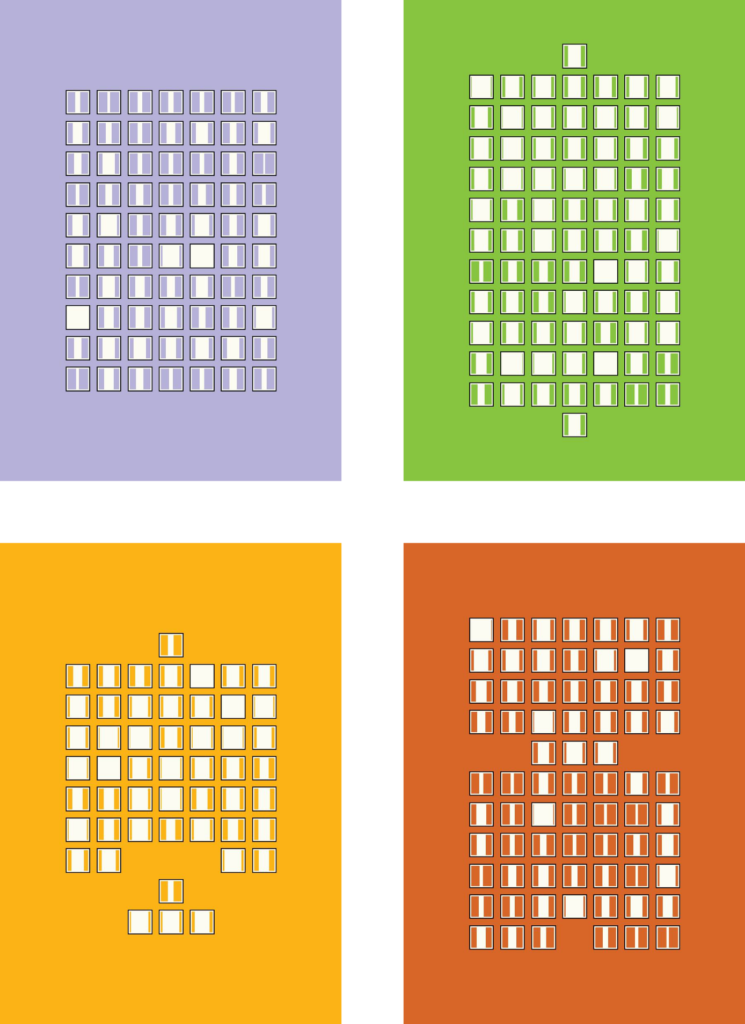
This first image visualized the idea of the novel by visualizing the rhythm. Each chapter gets a pair of simplified Japanese sliding doors – shoji. These doors open based on the chapter length. The animation is inspired by Murakami in two ways. First, the grid appears. The grid is the idea of the novel and the order of the appearance of this grid is based on the way the main character in Hard-Boiled Wonderland and The End of the World shuffles data in his head. With the grid completed, the animation starts opening doors chapter by chapter, mimicking the way Haruki Murakami writes the first draft of a novel: intuitively, in one go, and without thinking through each plot line.
I later added other novels the project. The main challenge here was finding new grids to put the chapters in. My first image was based on a story with 70 chapters and a nice 7 by 10 square grid. The other books don’t have a seven fold chapter count (obviously). After some tests, I decided to keep a 7-chapters-per-row layout for the other books. This way, the first book in the series influences the others. As none of the other books have a seven fold page count, I started playing with the placement chapters creatively based on a story element. Besides the grid, I use a story element to change the colors.
Besides the novels I visualized, I used What I Talk About When I Talk About Running and Novelist as a Vocation for research. I read the second book after a part of the series was made already (up to Killing Commendatore) and found some interesting similarities between Haruki Murakami’s writing style and my work. For example, he wants to:
… open windows in the mind of the reader and blow fresh air through them.
It’s not a stretch to view the squares in my image as windows. A gem of a find.
The project uses the Dutch editions for the data.