
If you been here before, you know that I like the stories by Haruki Murakami. They inspired me to create a data art series that visualizes the ideas behind the novels. That series might have come to a conclusion. It might also have not.
Has it really ended?
My series focused on the recent bigger novels by Murakami: the wind-up bird chronicle, 1Q84, Kafka on the shore, killing Commendatore, and the city and its uncertain walls. The visualization system works well with the data I use from each story. The series developed in roughly three phases.
- It started with the city. I read that story, loved it, and that made me start working on the idea.
- After that, I expanded the idea into a series by adding the stories I read before the city (1Q84, Kafka, and WUBC).
- It ended by adding killing Commendatore. The first book I read with the visualization system in place.
Okay, it really ended by the exhibition opportunities I had for the project and the personal reflections those resulted in.
But has it really ended? Murakami wrote way more novels than just the five I included: shorter novels, short story collections, and his memoir-esque books about running and writing. Adding all his work feel daunting. It also feels like a test for my system.
Getting to know Tsukuru Tazaki
I initially had the plan to add the colorless Tsukuru Tazaki and his years of pilgrimage to the series, but ended up not doing so. I made the decision based on page count and it gave me time to focus on the exhibitions. I planned to read it later, when I’d have time on my side again.
Having read it recently, I’m happy I did what I did. It is quite a different novel. It feels like south of the border. Besides feeling different, colorless Tsukuru Tazaki feels like a good starting point for a new part of the series. The city was the book that triggered the series. It is also the latest bigger novel he wrote. The colorless Tsukuru Tazaki is the latest shorter novel he wrote (though Kaho is around the corner at the time of my writing). So why not start with the latest one from a group of books again?
It might be a good rule to stick to.
So, here’s a first version of a data illustration inspired by the colorless Tsukuru Tazaki and his years of pilgrimage:
MAKE (working title)
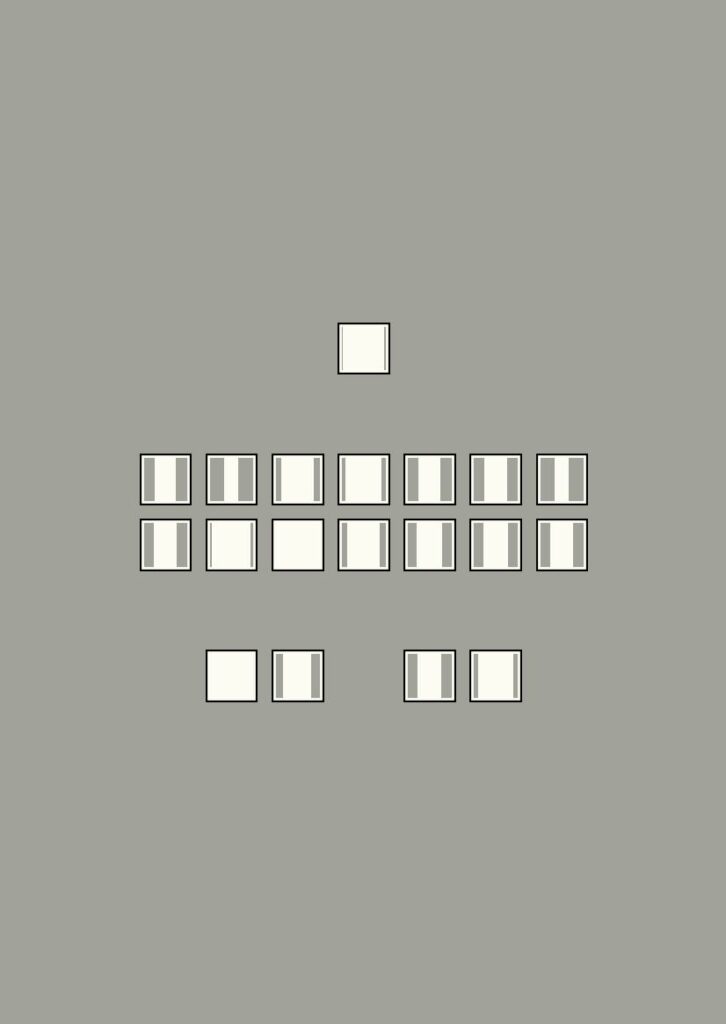
The first shoji resembles Tsukuru. The four at the bottom are his friends: two men (Blue and Red) and two women (Black and White). The image shows that Tsukuru was removed from the group of five and the break-up it triggered. It also shows the desire of Tsukuru to bury his memories. The color, warm gray, is inspired by the warm person that the colorless Tsukuru really is.
A sign to continue
I had a feeling I wanted to use a gray for this illustration. It feels like the most colorless color to me. When exploring the grays in a dictionary of color combinations (vol. 2) I immediately thought warm gray would be the perfect color. I also decided to check the examples that use the color in the book.
And then I saw this:
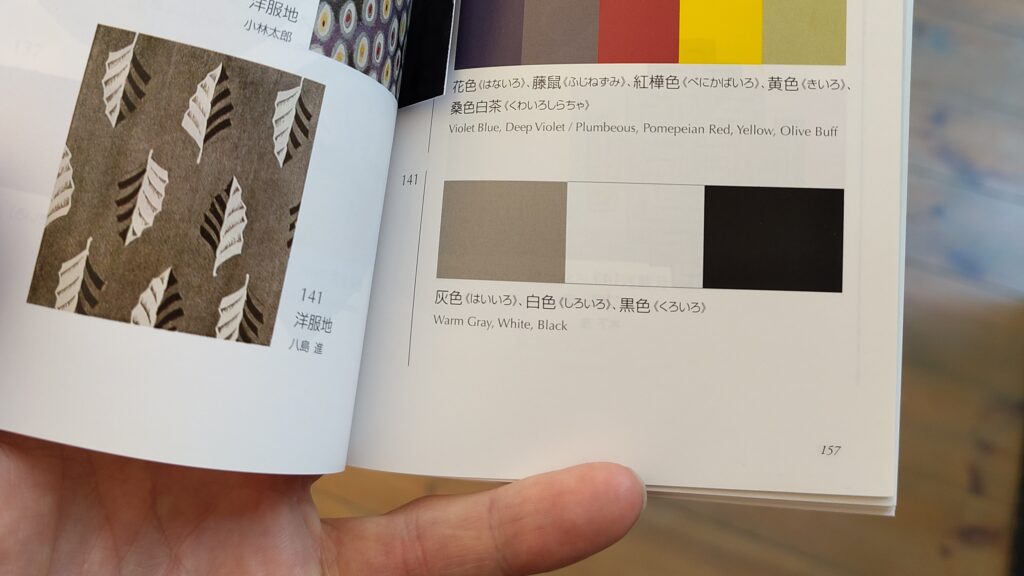
That color palette is a very minimal expression of the dream Tsukuru has of him with Black and White. A coincidence? Probably. A sign to continue my series? It might be.
(Continuing a series with 5 illustrations by reading a book about 5 friends also helps.)
A plan for the series
The next phase of the data art series will focus on his shorter novels. I’ll read a book or two per year in the upcoming years and see how my visualization system holds up. Expect an update on this in a few years or so. If it works well, I might explore another group of his novels. Maybe his non-fiction, maybe his collections.
Time will tell.