
I explore data and ideas using code. On this page you can see the projects I’ve worked on.
Avicii Open Data Art Project
Generating data art from music lyrics by using text analysis and abstract data visualisation. The project uses the Google Cloud Natural Language API for analysis and Python (Matplotlib) for visualisations. Read more.
Styled Static Routes
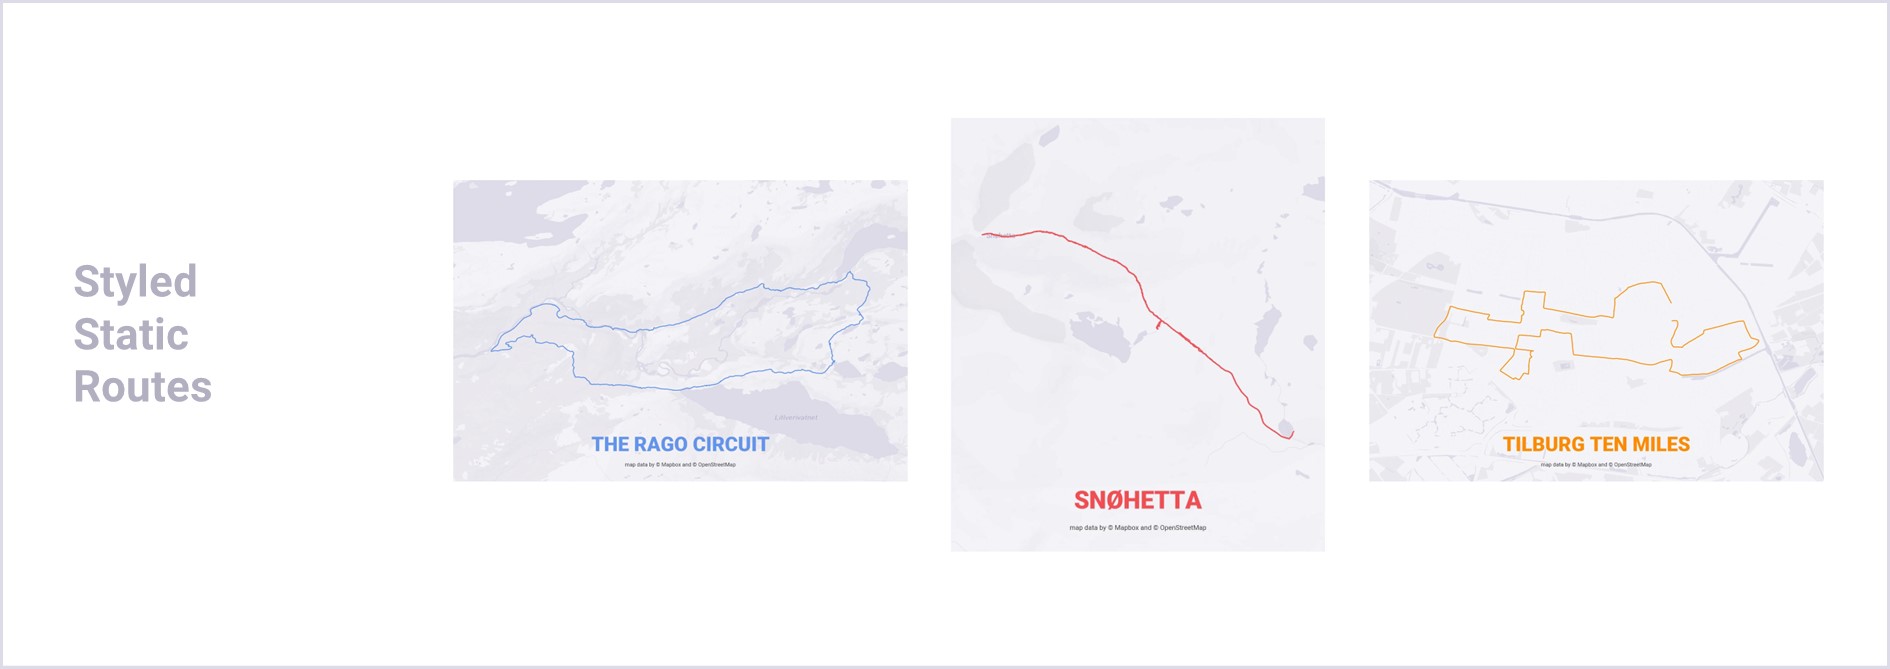
An easy way to create styled static maps. It uses Python to plot GPX routes and the Mapbox Static Images API to create the right background for that route. View repository on GitHub.
Garmin Watchface Design & Development
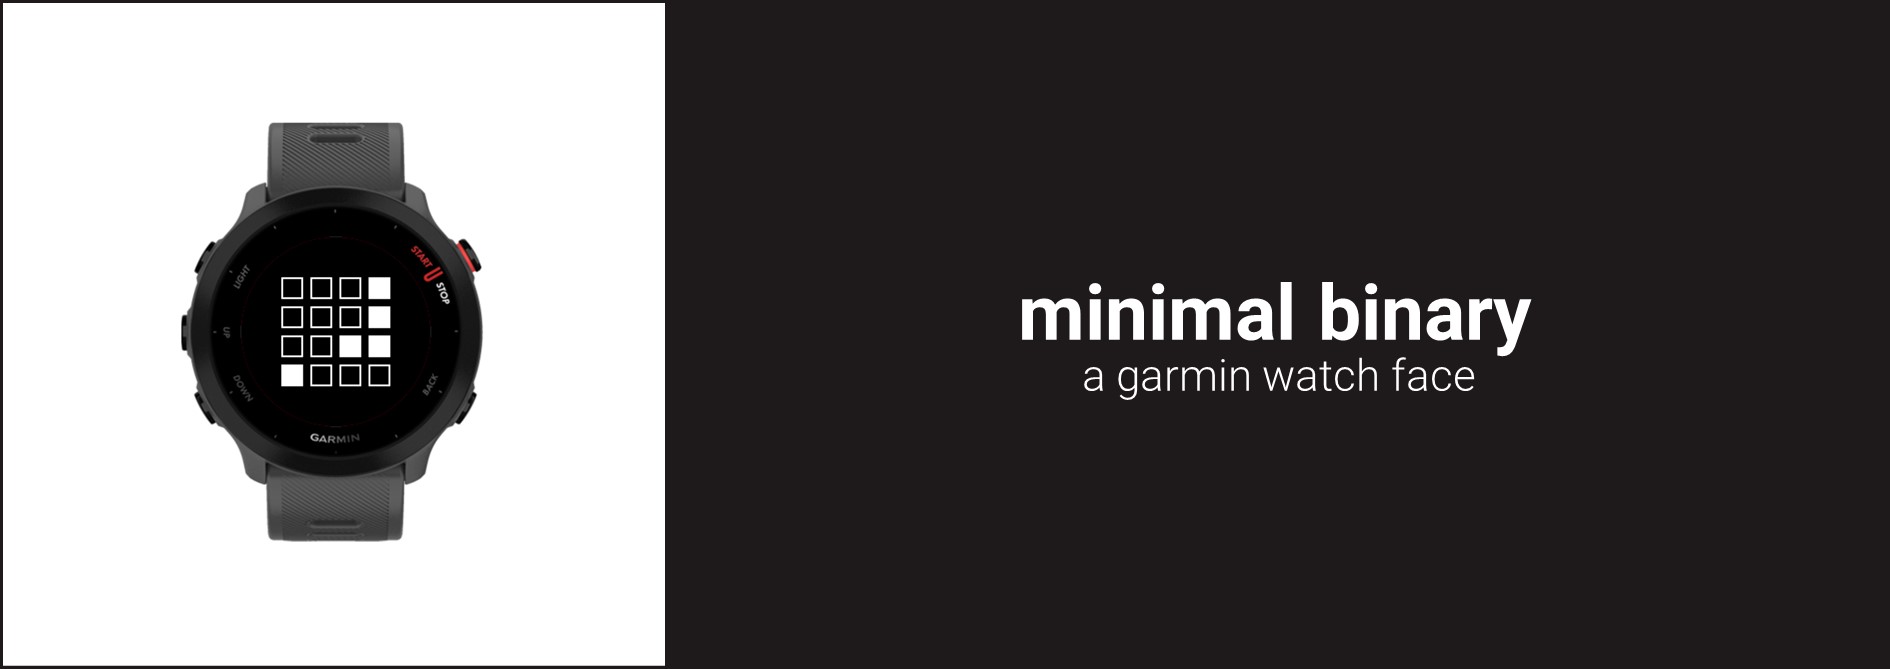
I design and develop my own Garmin watch faces. My first design has over 5K downloads and 50+ five-star reviews! The design is inspired on the sci-fi book Snow Crash and was developed using the Garmin Connect IQ SDK. Read more about my watchfaces.
Scrollytelling data stories
Avicii Project: a data story
My Avicii Open Data Art project, as listed above, is a project I keep coming back to. When I learned about scrollytelling with scrollama.js, I just had to develop a scrollytelling data story about it.
You can read it here (desktop design only) and look at the related git repo here.
Google’s view on heaven
An exploratory data story about the difference in sentiment in heaven and Heaven according to Google. Data analysed using the Google Natural Language API, visualised using d3.js and scrollama.js.
Data Storytelling with LionRock Maritime
Using data storytelling, I developed a webpage for LionRock Maritime that helps them explain their product to potential clients. The page uses a scrollytelling setup based on scrollama.js and d3.js.
Other projects
#DuBoisChallenge2024
In 2024, I joined the #DuBoisChallenge2024 and recreated 10 of W.E.B. Du Bois’s beautiful and impactful data portraits in Python and Matplotlib. You can find more info about the challenge and my code here.
Reporting Automation with LionRock Maritime
I automated the reporting process of LionRock Maritime by building a custom Python project. This reduced their time spent on reporting from ~1 day a week to <1 minute. View project page.
Star Wars Episode IV sentiment
An interactive website that explores the sentiment of the first Star Wars movie. Data analysed using the Google Natural Language API, visualisation made in Python (Matplotlib), interactivity added through vanilla JavaScript. View project ›
Three Body Problem Star Map
An interactive website that explores the books that helped me enjoy the Chinese scifi series The Three Body Problem Trilogy or Remembrance of Earth’s Past. Data visualised using d3.js. Open start map ›
Influencermoth: identifying influencers on Twitter
Automatically find influential people on Twitter using the Twitter Search API and d3.js for data visualisation. Read more.
What’s Data Sound?!
My first data sonification project. A Chrome plug-in that plays a sound whenever a tracker collects data. Developed using JavaScript. Read more ›
Tools & demos
- Book exploration: interactive network visualisation of books I’ve read and the topics they are associated to.
- Expression visualisation: interactive illustration made using d3.js to add interactivity to eyebrows and mouth of a custom svg illustration.
- Moral dilemma tool: proof of concept for a d3.js-based tool that helps people discuss moral dilemmas.
- Shapeshifter: a combination of a d3.js radial line chart and animations.
- …
Say hi
If you want to see if I can help you out, reach out to me here.