
It has been a while since I had a smartwatch. Back in 2015, I owned a Pebble Time. My time with the watch made me realise I don’t want a smartwatch. I started to dislike the notifications on my wrist and the watch had some connection issues every now and then. So after about a year of use, my first smartwatch-run came to an end.
Fast-forward to 2022, and things have changed. I have grown a running habit and so I got myself a new sport-focused smartwatch (a Garmin). As I still dislike the idea notifications on my wrist, I try to setup my smartwatch as a regular watch, disabling most features, and only using it to easily track my runs. I also like my smartwatch to look as watch-like as possible.
The cool thing about both the Pebble back then and the Garmin in modern times, is that they have an SDK (Software Development Kit). These allow users to build their own apps and watchfaces from scratch. This post is about the first watchface I created using the Garmin Connect IQ SDK. It shows how far I got with about three days of work and working 2-4 hours each day.
A note on my technical background: I have programming experience in Python, JavaScript and a tiny bit of Java and PHP. Prior to making a Garmin watchface, I had no experience with Monkey C (used by the Garmin SDK).
Day 1: Making a working watchface
I managed to do it. That’s nice. Here are some useful links:
-
Download Visual Studio Code: https://code.visualstudio.com/.
-
Download the Garmin SDK: https://developer.garmin.com/connect-iq/sdk/
-
Follow Garmin’s guides Getting Started & Your First App:
-
Tip: I had some issues installing the Monkey C extension for Visual Studio Code, because I selected the wrong one. When installing the Monkey C extension, make sure to select this one:
I like my running watch to look like a nice watch when I’m not running. Because of that, my design will not include any fancy stuff and only display time and battery. Using by Joshua The Miller, I figured out how to add extra data fields to the basic time display that the basic demo watch face, which I need to show the battery status . Thanks Joshua 🙂
Besides a battery indicatory, I plan to use squares in my design. Those squares need to be either filled, or not-filled with only a coloured edge. Using the graphics functions (link to docs) from the SDK, I can draw a blue 10×10 square:
 View.onUpdate(dc);
 dc.setColor(Graphics.COLOR_BLUE, Graphics.COLOR_BLACK);
 dc.fillRectangle(150, 150, 10, 10);
With my very limited knowledge of the Connect IQ SDK, I don’t think it’s possible to only colour the edge (or I’m just too lazy to go through the docs). So instead, I draw a second triangle over the first one, colouring it with the background colour (black), making it slightly smaller (8×8 instead of 10×10), and changing it coordinates by one pixel:
dc.setColor(Graphics.COLOR_BLACK, Graphics.COLOR_BLACK);
dc.fillRectangle(151, 151, 8, 8);
Here’s a screenshot:
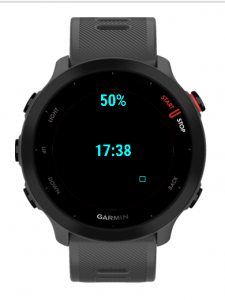
Note that I use a Forerunner 55 here, as that is the watch I own. When developing personal projects, I optimise for my own device first.
So the result after day one is a very basic watchface that shows time, battery life, and a square. More on that square on day 2.
Day 2: Design & test
The second day went well! I set out to apply yesterday’s knowledge to the design I have in mind and ended up having the watchface run on my own Garmin watch 🙂
As I wrote in my day 1 notes, I want to use a square in my design. Actually, my whole design is based on squares. My plan is to make a minimalistic watchface that shows time using binary indicators. The basic idea here is that an indicator is either on or off. In my design, this translates to a filled square (on) or a non-filled square (off). The right-most indicator shows binary value for 1, the one left to that indicates 2, the next shows 4, and the fourth and left-most shows 8.
Here are some sketches that make the idea a bit more visual, and probably easier to understand:
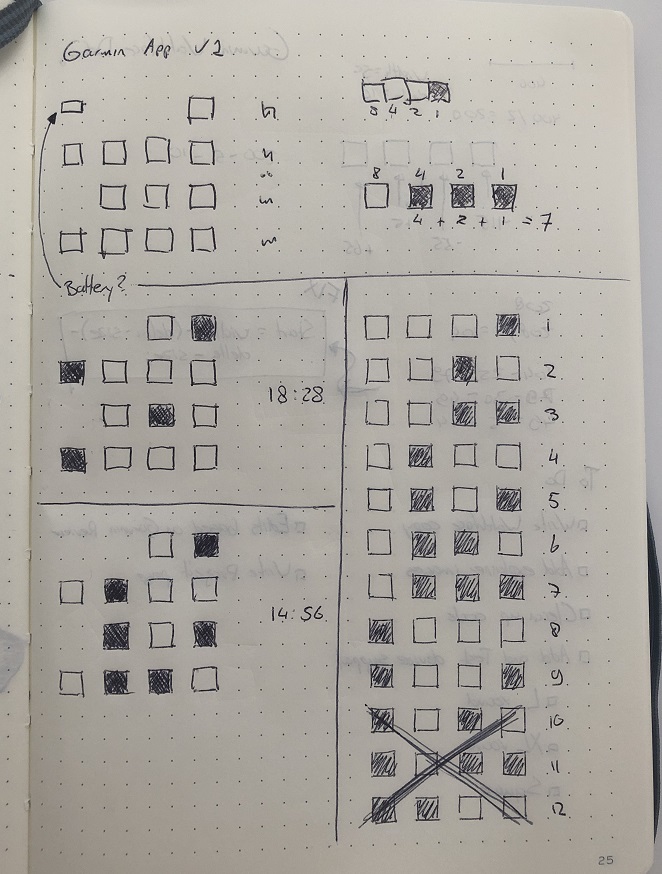
Now all I need is to draw enough squares and set their state based on the time. I need 13 squares for my design:
-
X0:00 – the first hour marker – value range 0-2 – squares needed: 2
-
0X:00 – the second hour market – value range 0-9 – squares needed: 4
-
00:X0 – the first minute indicator – value range 0-5 – squares needed: 3
-
00:0X – the second minute indicator – value range 0-9 – squares needed : 4
To make it a bit easier to draw these squares, I added function to my project to draw them:
private function drawBinarySquare(dc, x, y, size, squareActive){
var squareColor = Graphics.COLOR_WHITE;
dc.setColor(squareColor, squareColor);
dc.fillRectangle(x, y, size, size);
if(squareActive == false){
dc.setColor(Graphics.COLOR_BLACK, Graphics.COLOR_BLACK);
dc.fillRectangle(x+2, y+2, size-4, size-4);
}
}
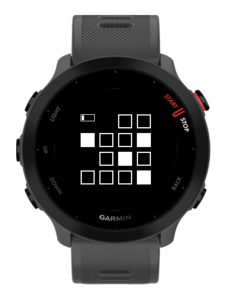
Using this function, I first created what I call a debug version of the watchface. This version shows time as both text and a grid of squares. It makes it easy to check if my binary indicators are working properly:
After testing my watchface using this setup, I started moving towards the final design. I implemented a few changes:
-
Remove text labels for battery and time.
-
Change the colour from blue to white.
-
Increase the size of the squares.
-
Centre the grid of squares.
-
Add small battery indicator for remaining battery life.
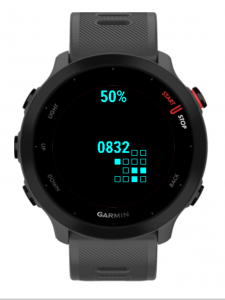
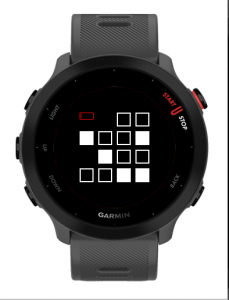
Here’s the result of those changes:
I thought it would be nice if the battery indicator would change colour if it was below a certain value, when it’s close to charging time. I decided to have it turn red when it’s below 10%:
Whoop whoop!
Feeling pleased with the design I have, I wanted to see how easy it would be to get it running on my physical Garmin watch. It turns out to be really easy! Using , it only takes a couple of minutes. And while the watchface is awaiting review by Garmin (it can take up to 3 days, update: it took about 5 hours), you can already send it to your watch via the website. Nice and easy! Good job Garmin 🙂
When you plan to release an app, there’s a small form with app details you need to fill out. Today, I just quickly filled it with content and some images. Tomorrow, I plan to spend more time on the information I use to describe my watchface. Besides that, I want to run some simulations for other watches to see how my design works on bigger screens. My design should dynamically put the grid of squares in the middle of the screen. But I’d better be safe than sorry.
Day 3: Scale and release
After using my watchface for a day, I ran into two things that I updated:
-
I made a mistake in setting the 10 and 20 hour indicators (first row).
-
Add support for the 12h/24h user settings.
When adding more support for the other watches, I had some publication issues. These were caused by some preview models that aren’t actual watches (e.g. <iq:product id="fenix6prosystem5preview"/> and <iq:product id="venu2system5preview"/>). Remove these from your product list in the manifest.xml.
Some notes about testing a watchface design: I can only simulate how it runs on other watches using the SDK, I cannot test them on an actual device (as I only own one). I approached testing like this: I looked for images of the available watches in the SDK and checked how the screens looked. If my design would fit on it, I enabled it for my watchface project. After that, I ran a simulation for each of the main watch types (e.g. 1 type of Garmin Fenix 6).
Besides that, I couldn’t find the list of information you need to fill out for the app when publishing. I’ve added it here so you can get an idea of what you need:
-
Title
-
Description
-
What’s new (version log) (optional)
-
Hero image (1440×770) (optional) > this is used as the header image on your app page
-
Category (I went for Geek)
-
Privacy Policy (yes/no) > if yes, this requires a privacy policy
-
ANT+ Profile (yes/no) > if yes, check relevant profiles
-
Regional limits (yes/no)
-
Cover image (for store listing)
-
Screen images (1 required, 4 optional) > as my time display needs some explanation, I used 3 of the available slots for a ‘how to read’ guide.
-
Preview video (optional)
-
Additional information
-
Monetization (yes/no)
-
Companion app (optional)
-
Additional hardware requirements (optional)
That’s it.
Now the last thing I decided to do (for now) was to share my watchface in the Showcase thread of the . This should help me get some reactions on both the design and functionality.
Conclusion
Before setting out on this three-day project, I was hoping to end up with my own watchface running on my watch. And I’m happy that I managed to get to that point. Having spent three days with the Connect IQ SDK, I must say I’m positively surprised by how easy it is to use (keeping in mind that my watchface’s functionality is pretty limited). I can honestly say I had fun developing the watchface 🙂 and that is always a good sign.
You can view the watchface in the Garmin IQ store