
This post is inspired by the work of Refik Anadol. He’s an artist that creates generative art using data and AI. The work in my post is more simple. It shows you how to use images and data visualisation to create painting-like objects.
In this post, you’ll learn how to make video like the one you see below:
This video was entirely generated by Python.
The goal of my post is to show you how you can apply your skills in creative ways. Therefore, I won’t share full code examples, but only pseudo-code and pointers. If you want to make this work, you’ll have to write the code yourself. (I made it work in Python, but it should be easy to make it work in a different programming language as you read along.)
With that out of the way, let’s get to it.
The inspiration
I was visiting the exhibition Living Paintings: Nature in Rotterdam. The exhibition shows a few works of Refik Anadol. There was one painting that caught my eye.
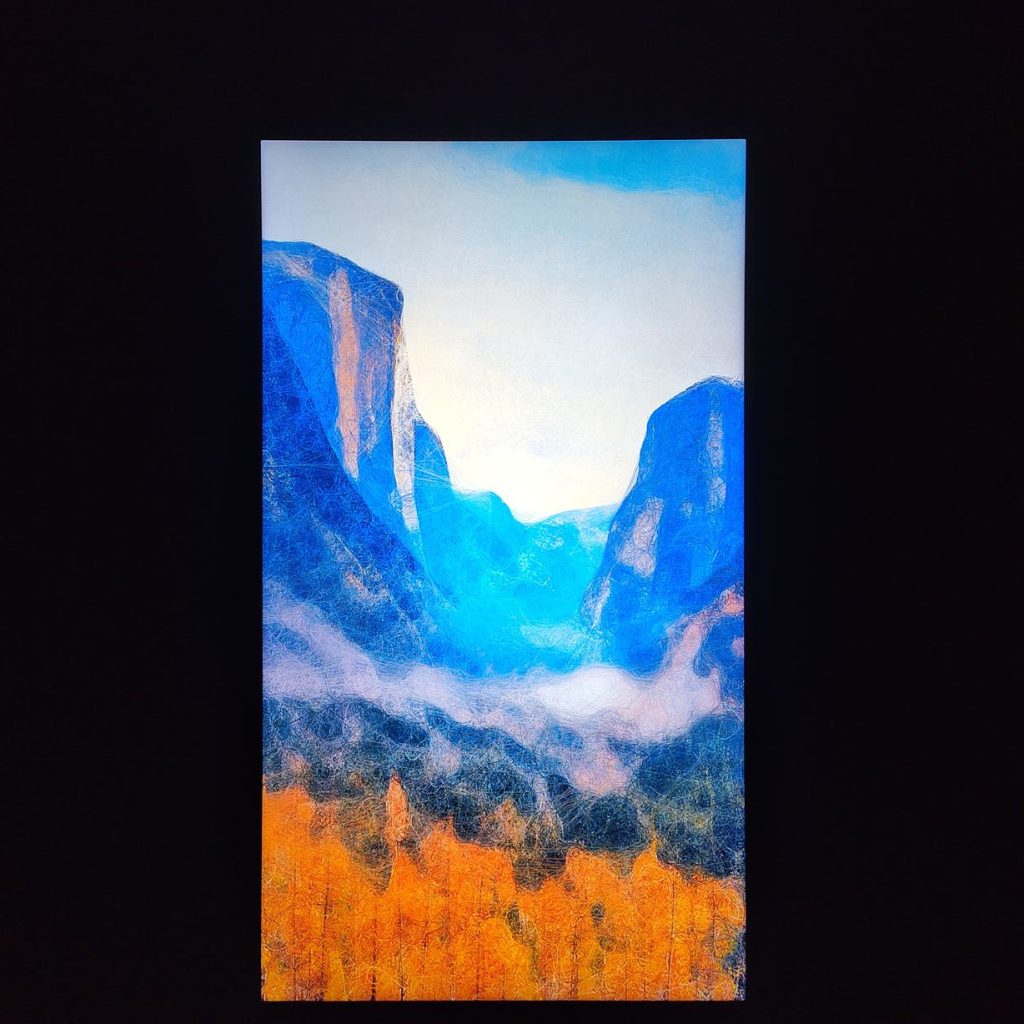
And I looked at this piece more closely:
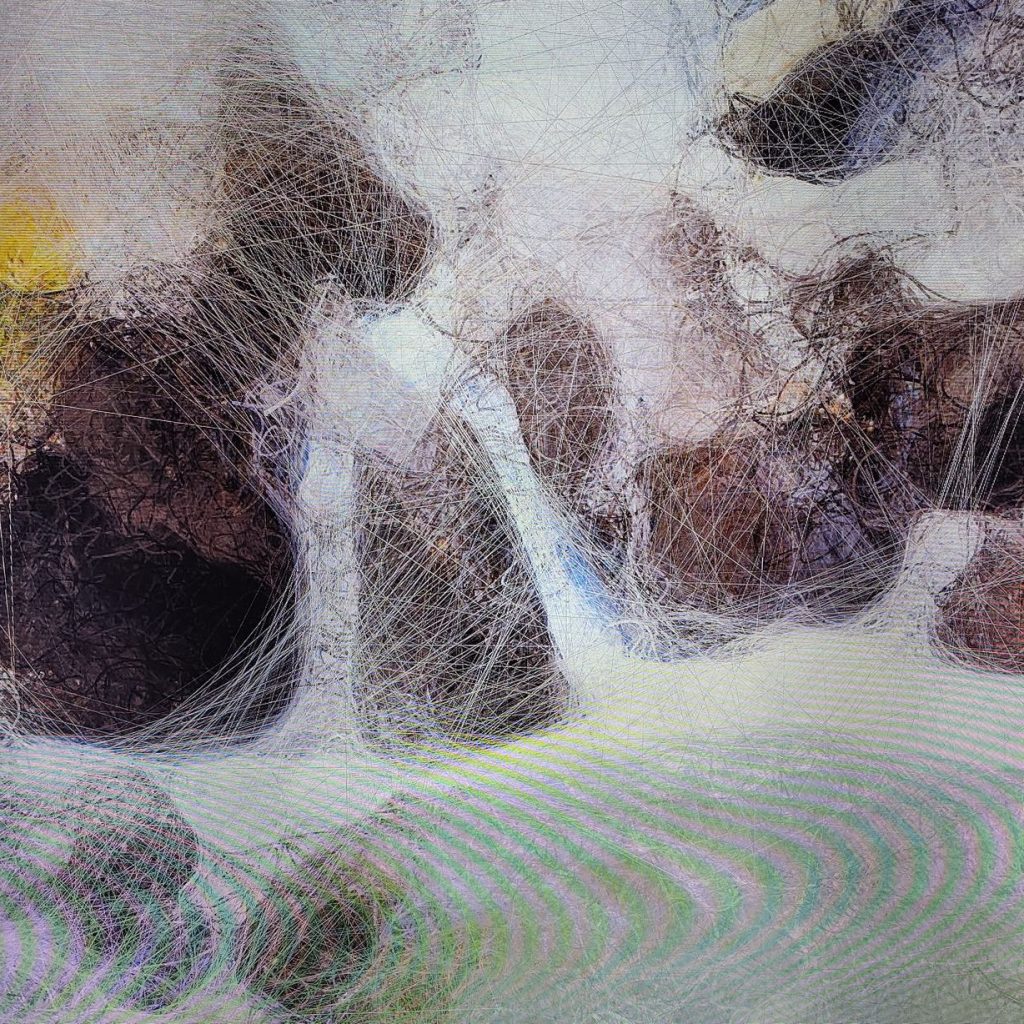
The details in his work reminded me of impressionist painters. It triggered my imagination and I started wondering: can I make something like this using my data skills?
The idea
The idea I have is to use some holiday pictures to create a living painting of my own. I know roughly what I need to do:
- Load images
- Transform images into data, pixel by pixel
- Draw painting-like objects with the data using line charts
- Create an animation based on the paintings
With these high-level ideas I get to work.
Want to test your skills? See if you can make it work using just these four ideas!
1: Load images with PIL.Image
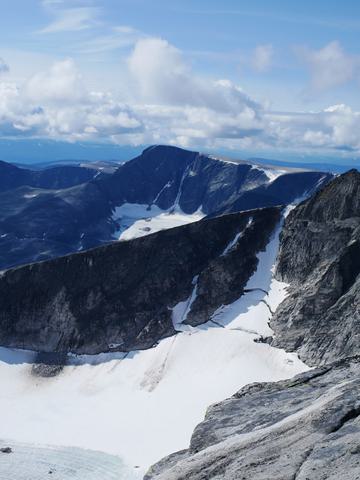
The first thing we need are images. Images that Python can read. My goals is to make a living, moving, painting. To get there, I need multiple images. Where Anadol uses AI to generate images, I decide to take a more simple approach: a selection of holiday pictures.
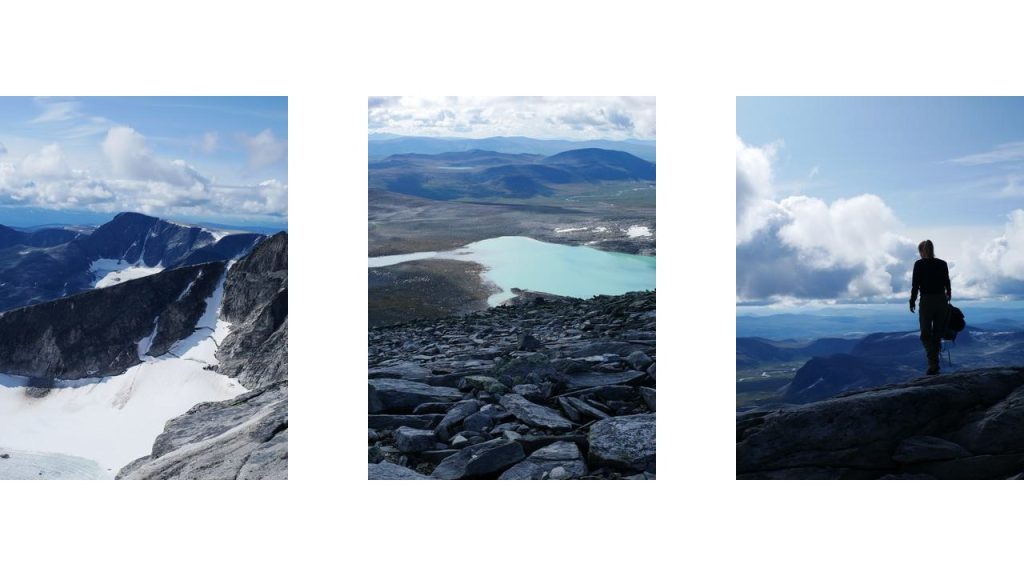
I decide to go with three images for my animation. I also go for three images from the same area, to make sure they have similar colours.
Using PIL.Image you can load these images as image objects.
Modern image files are quite big (mine are ~8MB) and I plan to process them pixel by pixel later on (which comes down to ~16 miljon pixels per image). Later on, we use the pixel data to generate paintings. Doing that will take a long time on my little laptop. Luckily the PIL package allows you to resize images and that reduces the total pixel count.
To speed up your code, update it so it resizes your images. I run my code with images of 360 x 480 pixels.
2: Transform images into data, pixel by pixel
With the images loaded and resized, it’s time to read their data. This is fairly easy to do.
I want to read the images pixel by pixel and can do so by following these steps:
- Fetch the image width and image height
- Make a nested for loop using the width and height (e.g.
for x in range(img_width)) - Use the loop to fetch image colour using
getpixel((x,y)) - Fill a list with a data object (a
dict) per pixel that holds the coordinates and colour.
The work of Refik Anadol that inspired me, seemed to draw lighter lines in the top layer. To make this possible in my code, I need to sort the pixel list based on the total colour value. A way to do this by adding up the colour values to a total colour value.
Modify the for loop so that it adds the total value to the pixel object. After that, you can sort the objects based on the total colour value.
3: Draw paintings with the data using line charts
Now on to the fun part: drawing the paintings. You can do this with any data visualisation package. I chose to use Matplotlib, and when people hear this package, plots like this come to mind:
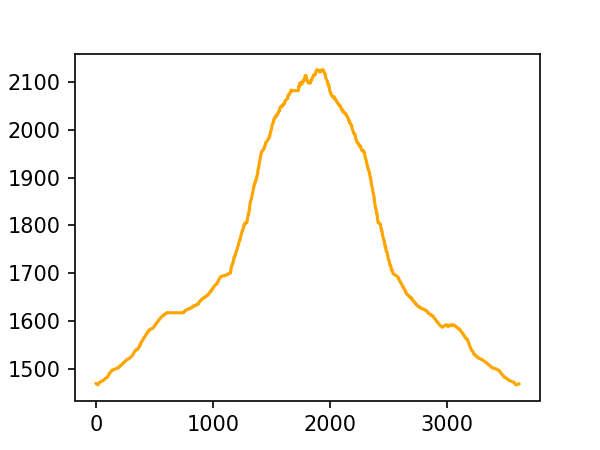
What people forget is that Matplotlib is super flexible, just as most programmatic ways to visualise data. With the same basic plot options and tweaks, we can turn pixels from an image like this:
Into the painting-like object you see below:
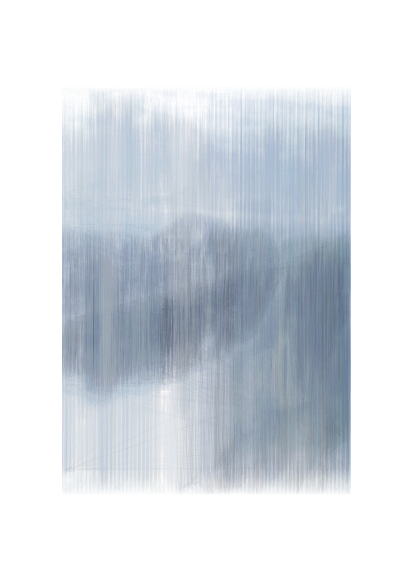
Pretty nice right?
Here are a few pointers that help your code achieve this effect:
- Disable the axis, so you have a blank canvas
- Loop through the (sorted) pixels
- Draw a line per n pixels (I decided to go with 6)
- Set the colour of the line (I decided to go with the color of the final pixel in the line)
- Play with settings like alpha and linewidth
A setup like this will generate a large number of lines. For my resized images, the code still draws 28.800 lines per image!
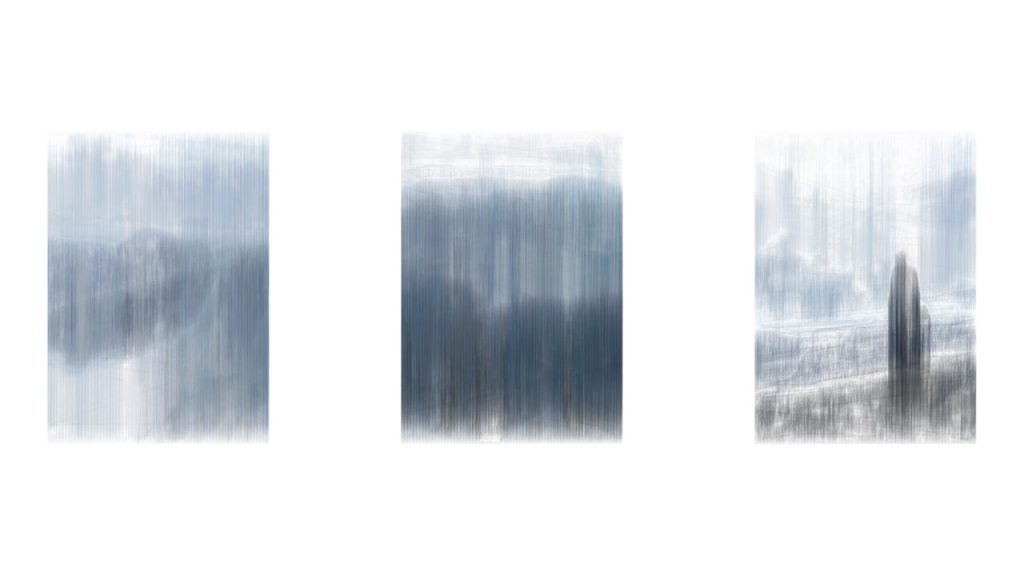
And since it’s all code, it can easily be done for other images as well. Here’s the output of my three input images:
Two bonus tips:
- Depending on your input image size, this code might take a long time to complete. Consider implementing a progress tracker (e.g. print the % completed).
- If your code takes a long time to complete, consider resizing your images to a smaller size. You can always increase the size again when you’ve fully tested the code.
4: Create an animation based on the paintings
Now how do you get from these nice images to a moving, living painting? Again, it’s pretty easy. Technically, a video is nothing more than a collection of sequential images. So that is what we need.
- Save intermediate steps: You can use the code you wrote before and save your plot after a new line has been added. But be careful. Each image is a frame in the video. If the video has a framerate of 12 frames per second (fps) and you have three images of 28.800 lines each, that will result in a 2-hour video! It’s fun, but a bit much for a first test. (I went for a new image every 400 lines).
- Layered paintings: make sure the code continues painting a new image on top of a completed one. That way, the final video will slowly move from one painting to the next.
- Yo yo: for video that has a bit of an end to it, consider implementing a yo yo effect. You can do so by reading a list of images, making a copy of the list, reverting the list, and adding it to your original list.
Alright, if you get all this to work, you have a list of images ready. Using a package like cv2, you can generate a video.
And that gets us back to the video we started with:
Pretty cool for a a collection of line charts right?